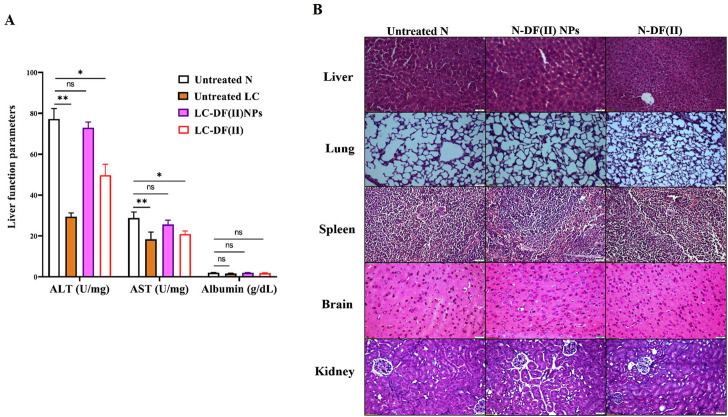
FIGURE 6.
Impact of DF(II) complexes on liver function parameters as well as histological assessment of their toxicity on tissues of the treated N groups (A) Liver function indexes (ALT, AST, and albumin) in healthy N group and the untreated and treated LC groups. Healthy N group was compared to the untreated and DF(II) complexes-treated LC groups, considering statistically significant at p ≤ 0.05*, ≤0.005**, and ≤0.001*** (B) H&E staining tissues of DF(II) NPs- and DF(II)-treated N groups compared to the untreated healthy N groups.

