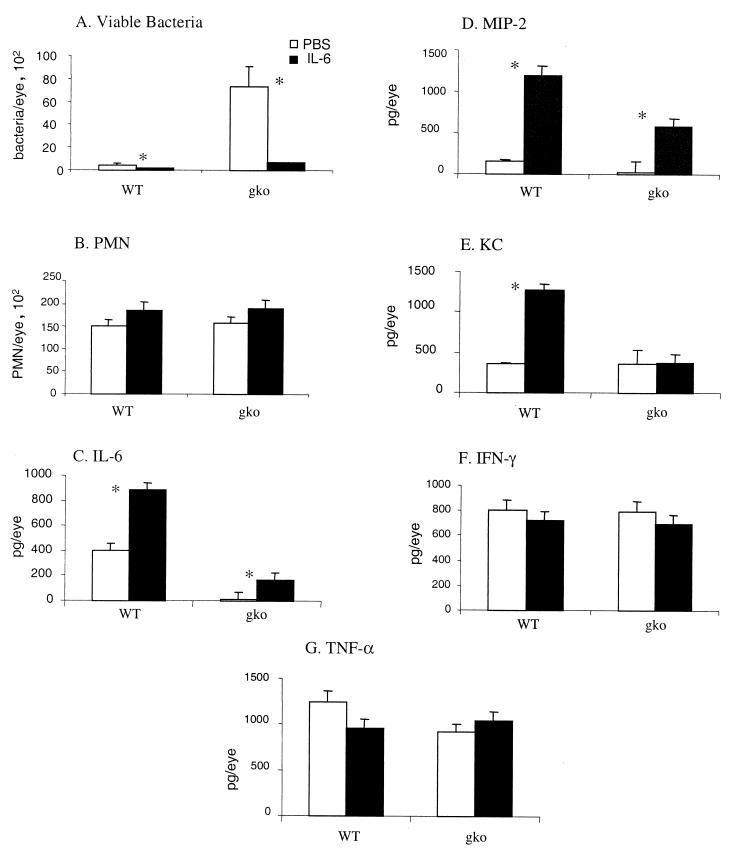
FIG. 2.
Numbers of viable bacteria and PMN and cytokine production in the eyes of IL-6 gko and wild-type mice 12 h after challenge with P. aeruginosa after treatment with either PBS or IL-6. Histograms represent the mean of observation from the experiment, and vertical bars indicate standard errors. ∗, P < 0.05. (A) Viable bacteria; (B) PMN; (C) IL-6; (D) MIP-2; (E) KC; (F) IFN-γ; (G) TNF-α.

