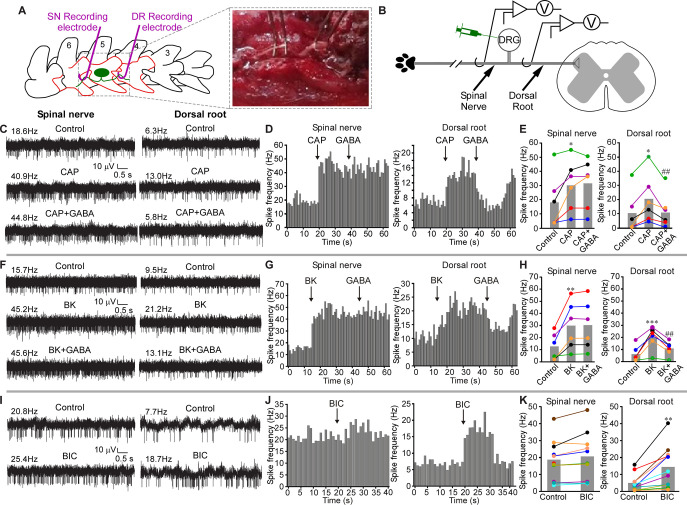
Fig 1. GABAergic filtering of nociceptive signals at the DRG.
(A) Schematic of surgical exposure of the L5 SN (left), L5 DRG, and the DR (middle) in an anesthetized rat. Parts of the vertebra that are surgically removed are shown in orange. SN and DR are then individually suspended on fine hook electrodes; DRG is exposed to direct drug application. (B) Schematic of the electrode placement. (C) Hindpaw injection of Capsaicin (CAP, 10 μM, 50 μl) increased firing frequency in both SN and DR branches of the nerve (middle traces, as compared to basal activity shown in the upper traces). Application of GABA (200 μM, 3 μl) to DRG reduced CAP-induced firing frequency in DR but not SN (bottom traces). (D) Histograms of firing frequencies from panel C. (E) Summary of experiments as in panel C. Two-factor repeated measures ANOVA, with factors of nerve site (SN, DR) and drug treatment (Control, CAP, CAP+GABA) revealed main effects associated with nerve site [F(1,10) = 15.1; p < 0.05] and drug application [F(2,9) = 12.8; p < 0.05], and there was significant interaction between these factors [F(2,9) = 7.9; p < 0.05]. Bonferroni post hoc test: *significant difference from control (p < 0.05); ##significant difference from CAP (p < 0.01). (F–H) Similar to C–E, but Bradykinin (BK, 100 μM, 50 μl) was hindpaw injected, instead of CAP. (H) Two-factor repeated measures ANOVA: main effect associated with drug application [F(2,9) = 12.0; p < 0.05]; significant interaction between nerve site and drug application [F(2,9) = 11.5; p < 0.05]. Bonferroni post hoc test: **,***significant difference from control (p < 0.01, p < 0.001); ##significant difference from BK (p < 0.01). (I–K) GABAA antagonist bicuculline (BIC, 200 μM, 3 μl) was applied to DRG instead of GABA; hindpaw was not stimulated. (K) Two-factor repeated measures ANOVA: main effects associated with nerve site [F(1,20) = 7.7; p < 0.05], drug application [F(1,20) = 12.0; p < 0.01], significant interaction between nerve site and drug application [F(1,20) = 18.7; p < 0.01]. Bonferroni post hoc test: **significant difference from control (p < 0.01). Metadata for quantifications presented in this figure can be found at https://archive.researchdata.leeds.ac.uk/1042/. Schematics are drawn with Canvas X 2019. DR, dorsal root; DRG, dorsal root ganglion; SN, spinal nerve.

