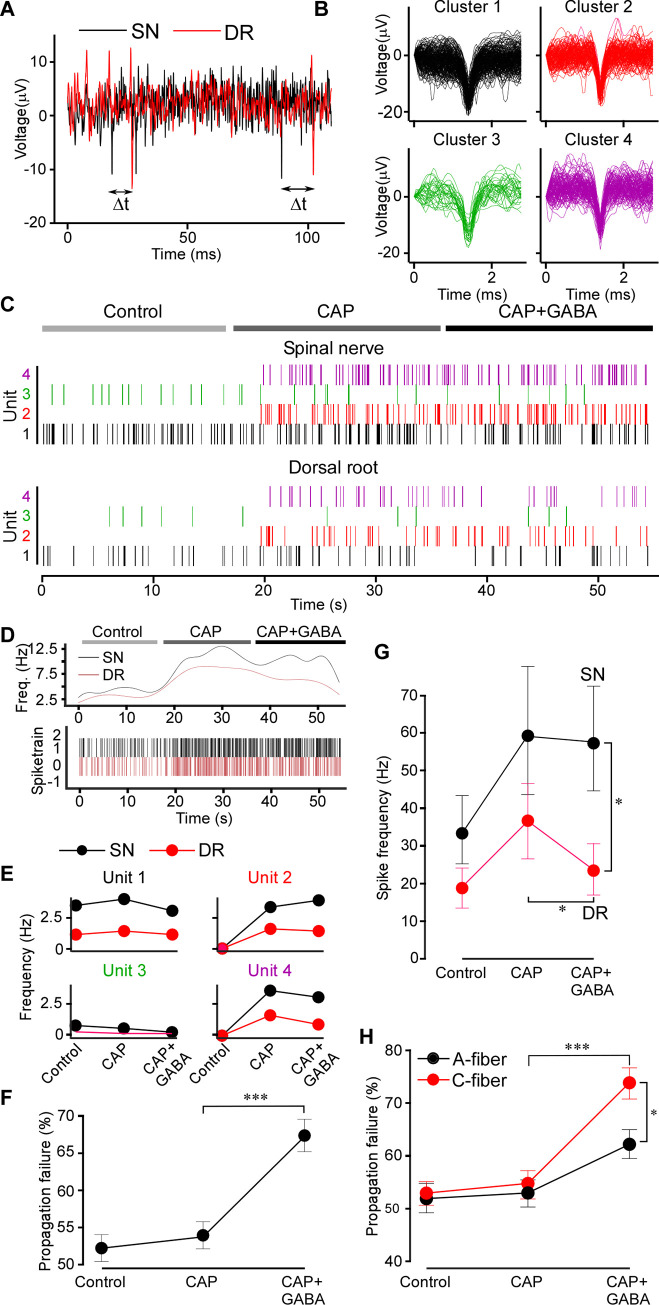
Fig 2. Spike analysis confirms GABAergic filtering.
(A) Latencies between the SN and DR spikes were measured; the minimum latency defined the SN origin of a DR spike. (B) Extracellular spike waveforms extracted from a spinal nerve recording and clustered using WaveClus. (C) Raster plot for each clustered waveform (denoted as Unit) under control, CAP and CAP+GABA conditions after matching the DR spikes with these in the SN. Note: capsaicin induced firing of specific units. (D) Instantaneous firing frequency of the all identified units shown in C in the DR and SN. (E) Firing rates of individual units identifies capsaicin-sensitive units. (F) Propagation failure (%) of all matched spike units under control, CAP and CAP+GABA conditions. One-way ANOVA: F(2,117) = 17.7; p < 0.001; Tukey post hoc test: ***significant difference from CAP, p < 0.001. (G) Average firing rates for all multi-unit nerve recordings in the dataset (n = 6) in SN and DR under control, CAP and CAP+GABA conditions. Two-factor (nerve site, drug application) repeated measures ANOVA: main effects associated with drug application [F(2,10) = 6.38; p < 0.05], significant interaction between factors [F(2,10) = 10.74; p < 0.01]. Bonferroni post hoc test: *significant difference from control (p < 0.05). (H) Units were divided into “C-type” and “A-type” based on the SN-DR latency (C: <1.2 m/s; A: >1.2 m/s) and propagation failure rate analyzed as in (F). Two-factor (fiber type, drug application) mixed-effects ANOVA: main effect associated with drug application [F(2,70) = 34.82, p < 0.001], significant interaction between factors [F(2,72) = 4.712, p < 0.05]. Sidak post hoc test: *significant difference between CAP+GABA and CAP, significant difference between A and C fibers (p < 0.05). Metadata for quantifications presented in this figure can be found at https://archive.researchdata.leeds.ac.uk/1042/. Code for spike sorting analysis is available at GitHub (https://github.com/pnm4sfix/SpikePropagation). DR, dorsal root; SN, spinal nerve.

