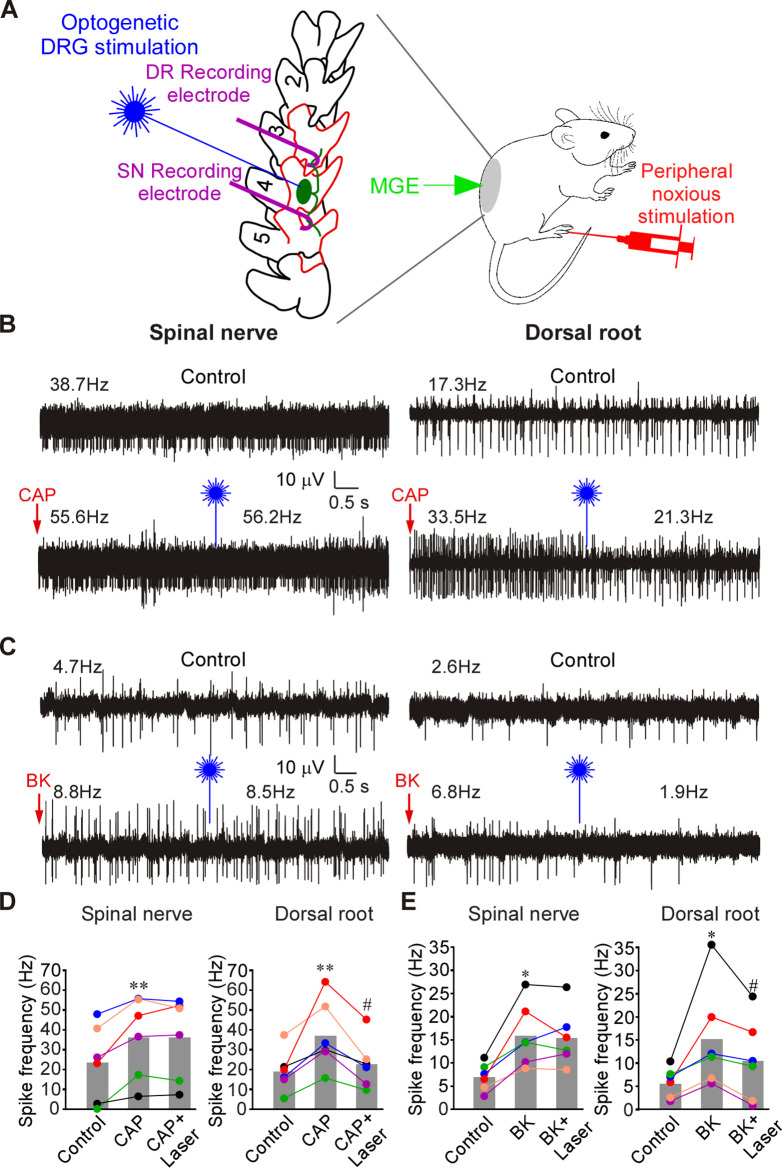
Fig 4. Optogenetic activation of MGE cells in DRG reduces frequency of firing induced by CAP or BK in the DR but not in the SN.
(A) Schematic of the recording paradigm: mice were DRG-transplanted with VGAT-ChR2-eYFP MGE cells 3–4 weeks before recordings; recordings were done as shown in Fig 1B (but from L4 DRG), supplemented with optical stimulation of the exposed DRG. (B) Hindpaw injection of CAP (10 μM, 20 μl; indicated by red arrow) increased firing frequency in both SN and DR. Application of 473 nm laser light to DRG (indicated by blue symbol) acutely reduced CAP-induced firing frequency in DR but not SN (bottom traces). (C) Experiment similar to A, but BK (100 μM, 20 μl) was hindpaw injected, instead of CAP. (D) Summary of panel B. Two-factor (nerve site, drug application) repeated measures ANOVA: main effect associated with drug treatment [F(2,9) = 11.4; p < 0.05] and significant interaction between nerve site and treatment [F(2,9) = 7.6; p < 0.05]. Bonferroni post hoc test: **significant difference from control (p < 0.01); #significant difference from CAP (p < 0.05). (E) Summary of panel C. Two-factor (nerve site, drug application) repeated measures ANOVA: main effect associated with nerve site [F(1,10) = 6.7; p < 0.05] and significant interaction between nerve site and treatment [F(2,9) = 9.5; p < 0.05]. Bonferroni post hoc test: *significant difference from control (p < 0.05); #significant difference from BK (p < 0.05). Metadata for quantifications presented in this figure can be found at https://archive.researchdata.leeds.ac.uk/1042/. Schematics are drawn with Canvas X 2019; vector diagram of laboratory mouse from Wikimedia was used in the panel E, https://commons.wikimedia.org/wiki/File:Vector_diagram_of_laboratory_mouse_(black_and_white).svg. DR, dorsal root; DRG, dorsal root ganglion; MGE, medial ganglionic eminence; SN, spinal nerve.

