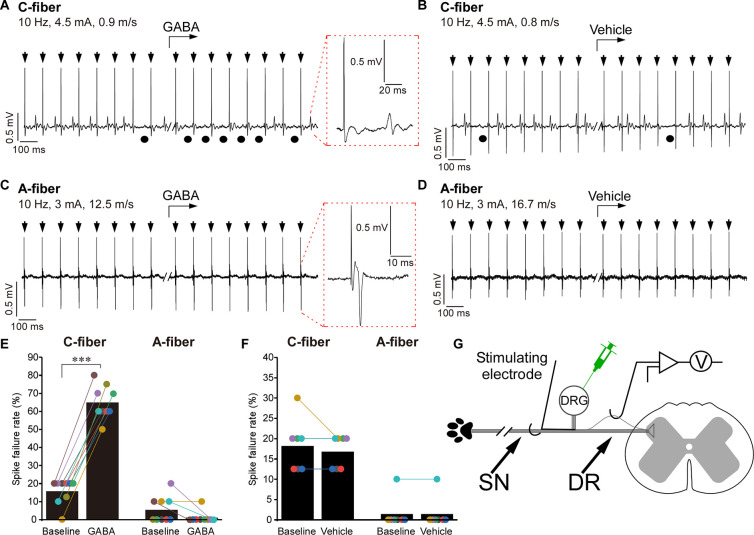
Fig 5. Single-unit recordings: DRG application of GABA induces spike failure at the DRG, which is specific to C fibers.
(A–D) Example traces of in vivo single-unit recording from the DR process of a rat C fiber (A, B) or A fiber (C, D); stimulus electrode is placed in the SN (schematic of the experiment is shown in panel D). Parameters of stimulation and conduction velocity are indicated above the trace. GABA (200 μM, 3 μl; A, C) or vehicle (3 μl saline; B, D) were applied to the DRG by a micropipettor at the time point indicated by the bent arrows. Stimulus artifacts are indicated by black arrows. Black circles under the traces indicate failed spikes. Spike waveform is shown on the extended time scale within the dotted red boxes. (E) Spike failure rate before and during application of GABA is analyzed for C and A fibers; n = 9 (1 recording per animal) for both fiber types; Kruskal–Wallis ANOVA: H(3) = 28.2, p < 0.001; Mann–Whitney post hoc test: ***significant difference from control (p < 0.001). (F) Similar to panel E but spike failure rates before and after the application of vehicle control are analyzed; n = 7 for both fiber types. No significant effects of the vehicle were found (Kruskal–Wallis ANOVA). (G) Schematic of the single-unit recording paradigm. Metadata for quantifications presented in this figure can be found at https://archive.researchdata.leeds.ac.uk/1042/. Schematics are drawn with Canvas X 2019. DR, dorsal root; DRG, dorsal root ganglion; SN, spinal nerve.

