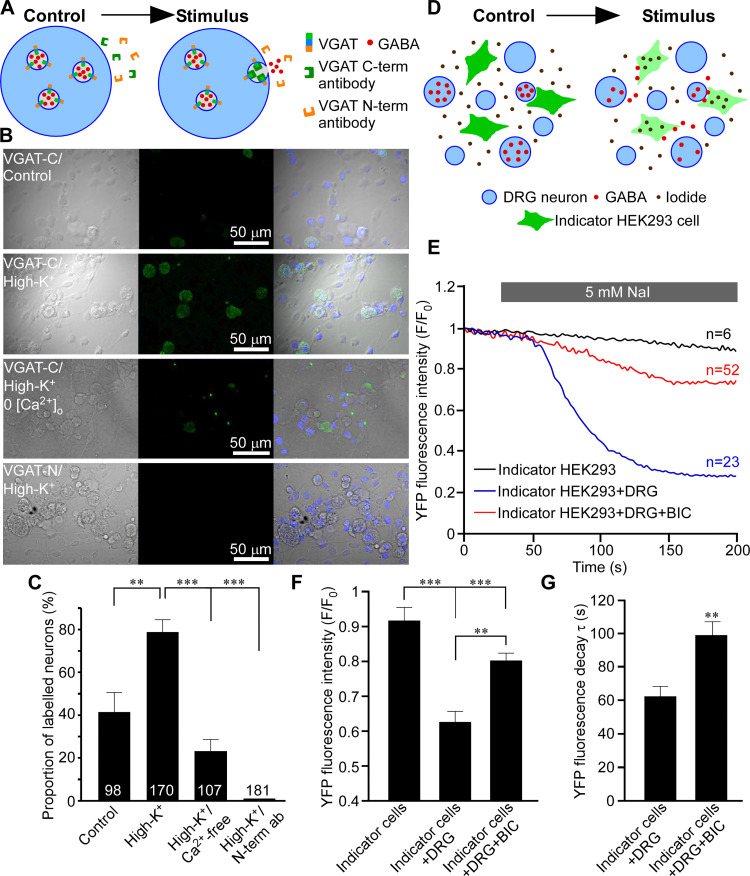
Fig 7. Activity-dependent and spontaneous release of GABA from DRG neurons.
(A–C) Vesicular GABA release from DRG neurons studied with luminal VGAT antibody uptake. (A) Schematic of activity-dependent uptake of luminal (C-terminal) VGAT antibody. (B) Bright-field (left), fluorescence (middle), and overlaid images of DRG culture incubated in the presence of either a luminal VGAT antibody (C-term; 3 upper rows) or a cytoplasmic (N-term; bottom row) antibody. Cells were incubated in the control extracellular solution (upper row) or depolarized by extracellular solution containing 100 mM KCl (second from the top and the bottom rows). In the second from the bottom row, Ca2+ was excluded from the extracellular solution. (C) Summary of experiments like these shown in B (N = 3–5, number of neurons is indicated within the columns); quantified is the percentage of stained neurons **p < 0.01, ***p < 0.01 (Fisher’s exact test with Bonferroni correction). (D–G) GABA release from DRG investigated with the use of indicator HEK293 cells. (D) Schematic of the experiment: HEK293 cells transfected with α1, β2, and γ2 subunits of GABAA receptors and a halide-sensitive EYFP mutant (H148Q/I152L; EYFP-QL) are co-cultured with DRG neurons and imaged in the presence of 5 mM extracellular iodide. When GABA is present in the extracellular solution, GABAA channel opening causes I- influx and EYFP-QL fluorescence quenching. (E) Application of NaI induced bicuculline-sensitive EYFP-QL quenching only when indicator HEK293 cells are co-cultured with DRG but not in monoculture; representative traces are shown for each experimental condition. (F) Summary for panel E; normalized fluorescence intensity is quantified at 200 s of each recording. Kruskal–Wallis ANOVA: H(2) = 33.6, p < 0.001; Mann–Whitney post hoc test: significant difference between indicated groups, **p < 0.01, ***p < 0.001. (G) Quantification of the kinetics of the EYFP-QL fluorescence quenching in experiments shown in E; individual recordings were fit with exponential function and time constants (τ) of the fluorescence decay were analyzed. Mann–Whitney test: U = 786, p < 0.01. In E and F, data from 3 independent experiments for each condition are shown, number of cells analyzed is indicated above each trace in panel E. Metadata for quantifications presented in this figure can be found at https://archive.researchdata.leeds.ac.uk/1042/. Schematics are drawn with Canvas X 2019. DRG, dorsal root ganglion.

