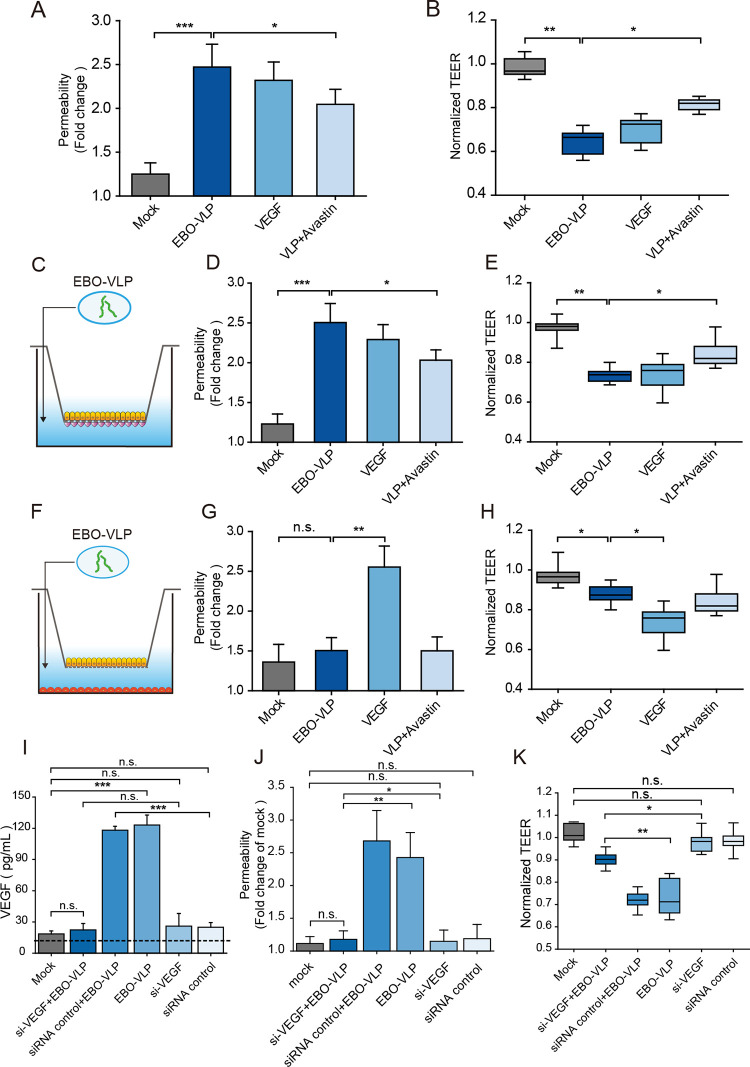
Fig 4. EBO-VLP causes iBRB breakdown through pericytes secretion of VEGF.
(A-B) Integrity of the tri-culture iBRB model after EBO-VLP, EBO-VLP + Avastin and VEGF treatment. Na-F permeability (A) and the TEER values (B) of the iBRB model were examined 48 h after EBO-VLP administration. TEER values were normalized to those of iBRB models themselves before EBO-VLP administration. The box and the whisker present the median ± percentiles (25–75%) and range, respectively. The fold change of permeability compared with iBRB model itself before EBO-VLP administration is presented as the mean ± standard deviation. All values were determined in ten independent experiments. (C) Experimental schematic showing the addition of EBO-VLPs to the iBRB co-culture model of HREC and HRP. (D-E) Integrity of the iBRB co-culture (HRECs and HRPs) model after EBO-VLP, EBO-VLP + Avastin and VEGF treatment. Na-F permeability (D) and the TEER values (E) of the iBRB model were examined after 48 h of treatment. TEER values were normalized to those of iBRB models themselves before EBO-VLP administration. The box and the whisker present the median ± percentiles (25–75%) and range, respectively. The fold change of permeability compared with iBRB model itself before EBO-VLP administration is presented as the mean ± standard deviation. All values were determined in ten independent experiments. (F) Experimental schematic showing the addition of EBO-VLPs to the iBRB co-culture model of HREC and HRA. (G-H) Integrity of the iBRB co-culture (HRECs and HRAs) model after EBO-VLP, EBO-VLP + Avastin, and VEGF treatment. Na-F permeability (G) and the TEER values (H) of the iBRB model were examined 48 h after EBO-VLP administration. All values were determined in ten independent experiments. (I) Changes in VEGF expression after EBO-VLP administration, as quantified by ELISA. Pericytes were transfected with si-VEGF or nontargeting control siRNA, followed by treatment with EBO-VLP for 48 h. The horizontal dashed line marks the limit of detection of the assay. The results are presented as the means ± standard deviation of three independent experiments. (J-K) Integrity of the tri-culture iBRB model after EBO-VLP, si-VEGF + EBO-VLP, nontargeting control siRNA + EBO-VLP, and nontargeting control siRNA treatment. Na-F permeability (J) and the TEER values (K) of the iBRB model were examined 48 h after administration. TEER values were normalized to those of iBRB models themselves before EBO-VLP administration. All values were determined in six independent experiments. Statistical analysis was performed using Student’s t test. *p < 0.05, **p < 0.01, ***p < 0.001.

