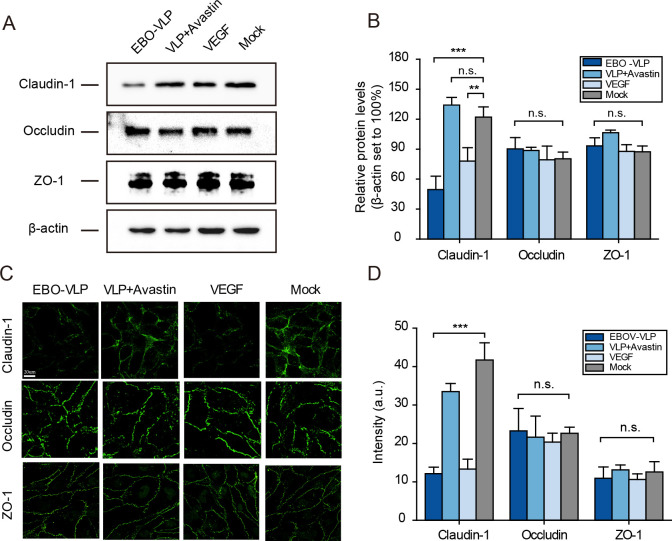
Fig 5. EBO-VLPs downregulate the tight junction protein Claudin-1 in the iBRB.
(A) Western blot analysis of claudin-1, occludin and ZO-1 expression in HREC at 48 h in the tri-culture iBRB model. Representative images of three independent experiments are shown. (B) Relative protein levels of claudin-1, occludin and ZO-1 were normalized to β-actin. The results are presented as the means ± standard deviation of three independent experiments. (C) Immunofluorescence images of claudin-1, occludin and ZO-1 expression in HRECs at 48 h post EBO-VLP treatment in the tri-culture iBRB model. Representative images of three independent experiments are shown. (D) Quantification of the fluorescence intensity of claudin-1, occludin and ZO-1 after EBO-VLP administration. The regions for fluorescence intensity analysis were determined in four independent experiments. **p < 0.01, ***p < 0.001.

