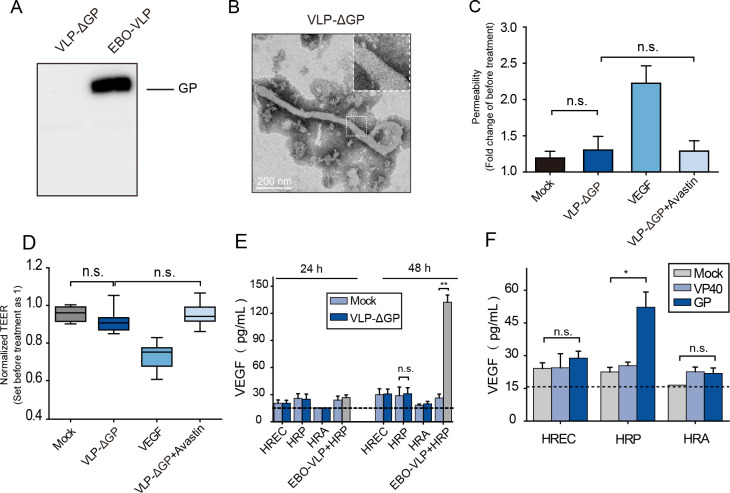
Fig 6. GP plays the major role in the destruction of the iBRB.
(A) Western blot analysis of VLP-ΔGP using an anti-GP antibody. Representative images of three independent experiments are shown. (B) TEM image of VLP-ΔGP. (C) Permeability and (D) TEER of the tri-culture iBRB model were measured 48 h after VLP-ΔGP, VLP-ΔGP + Avastin and VEGF treatment. TEER values were normalized to those of iBRB models themselves before EBO-VLP administration. The box and the whisker present the median ± percentiles (25–75%) and range, respectively. The fold change of permeability compared with iBRB model itself before EBO-VLP administration is presented as the mean ± standard deviation. All values were determined in six independent experiments. (E) The expression of VEGF in HRP after VLP-ΔGP treatment, as quantified by ELISA. The horizontal dashed line marks the limit of detection of the assay. The results are presented as the means ± standard deviation of three independent experiments. (F) The expression of VEGF in HRP after EBOV VP40 and GP was expressed in HRPs. The horizontal dashed line marks the limit of detection of the assay. The results are presented as the means ± standard deviation of three independent experiments. Statistical analysis was performed using Student’s t test. *p < 0.05, **p < 0.01.

