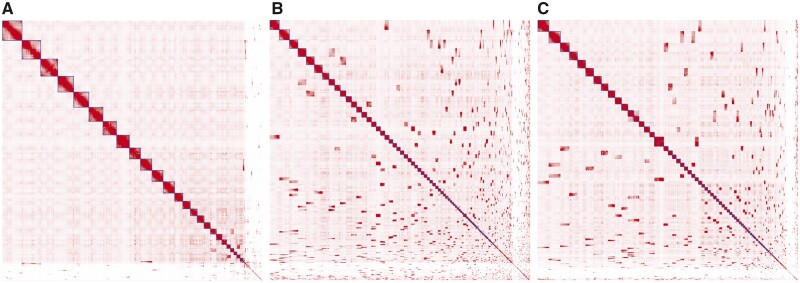
Fig. 1.
Hi-C contact maps of genome assemblies constructed with YaHS (A), SALSA2 (B) and pin_hic (C) for the simulated T2T data without contig errors. The intensity of colour indicates the density of Hi-C read pairs shared between the positions on the x- and y-axis, with darker pixels indicating higher densities. The blocks highlighted with squares along the main diagonal are scaffolds constructed by the tools. The dark off-diagonal blocks indicate scaffold pairs that could be further joined for construction of larger scaffolds. The contact maps were plotted with Juicebox (Durand et al., 2016)

