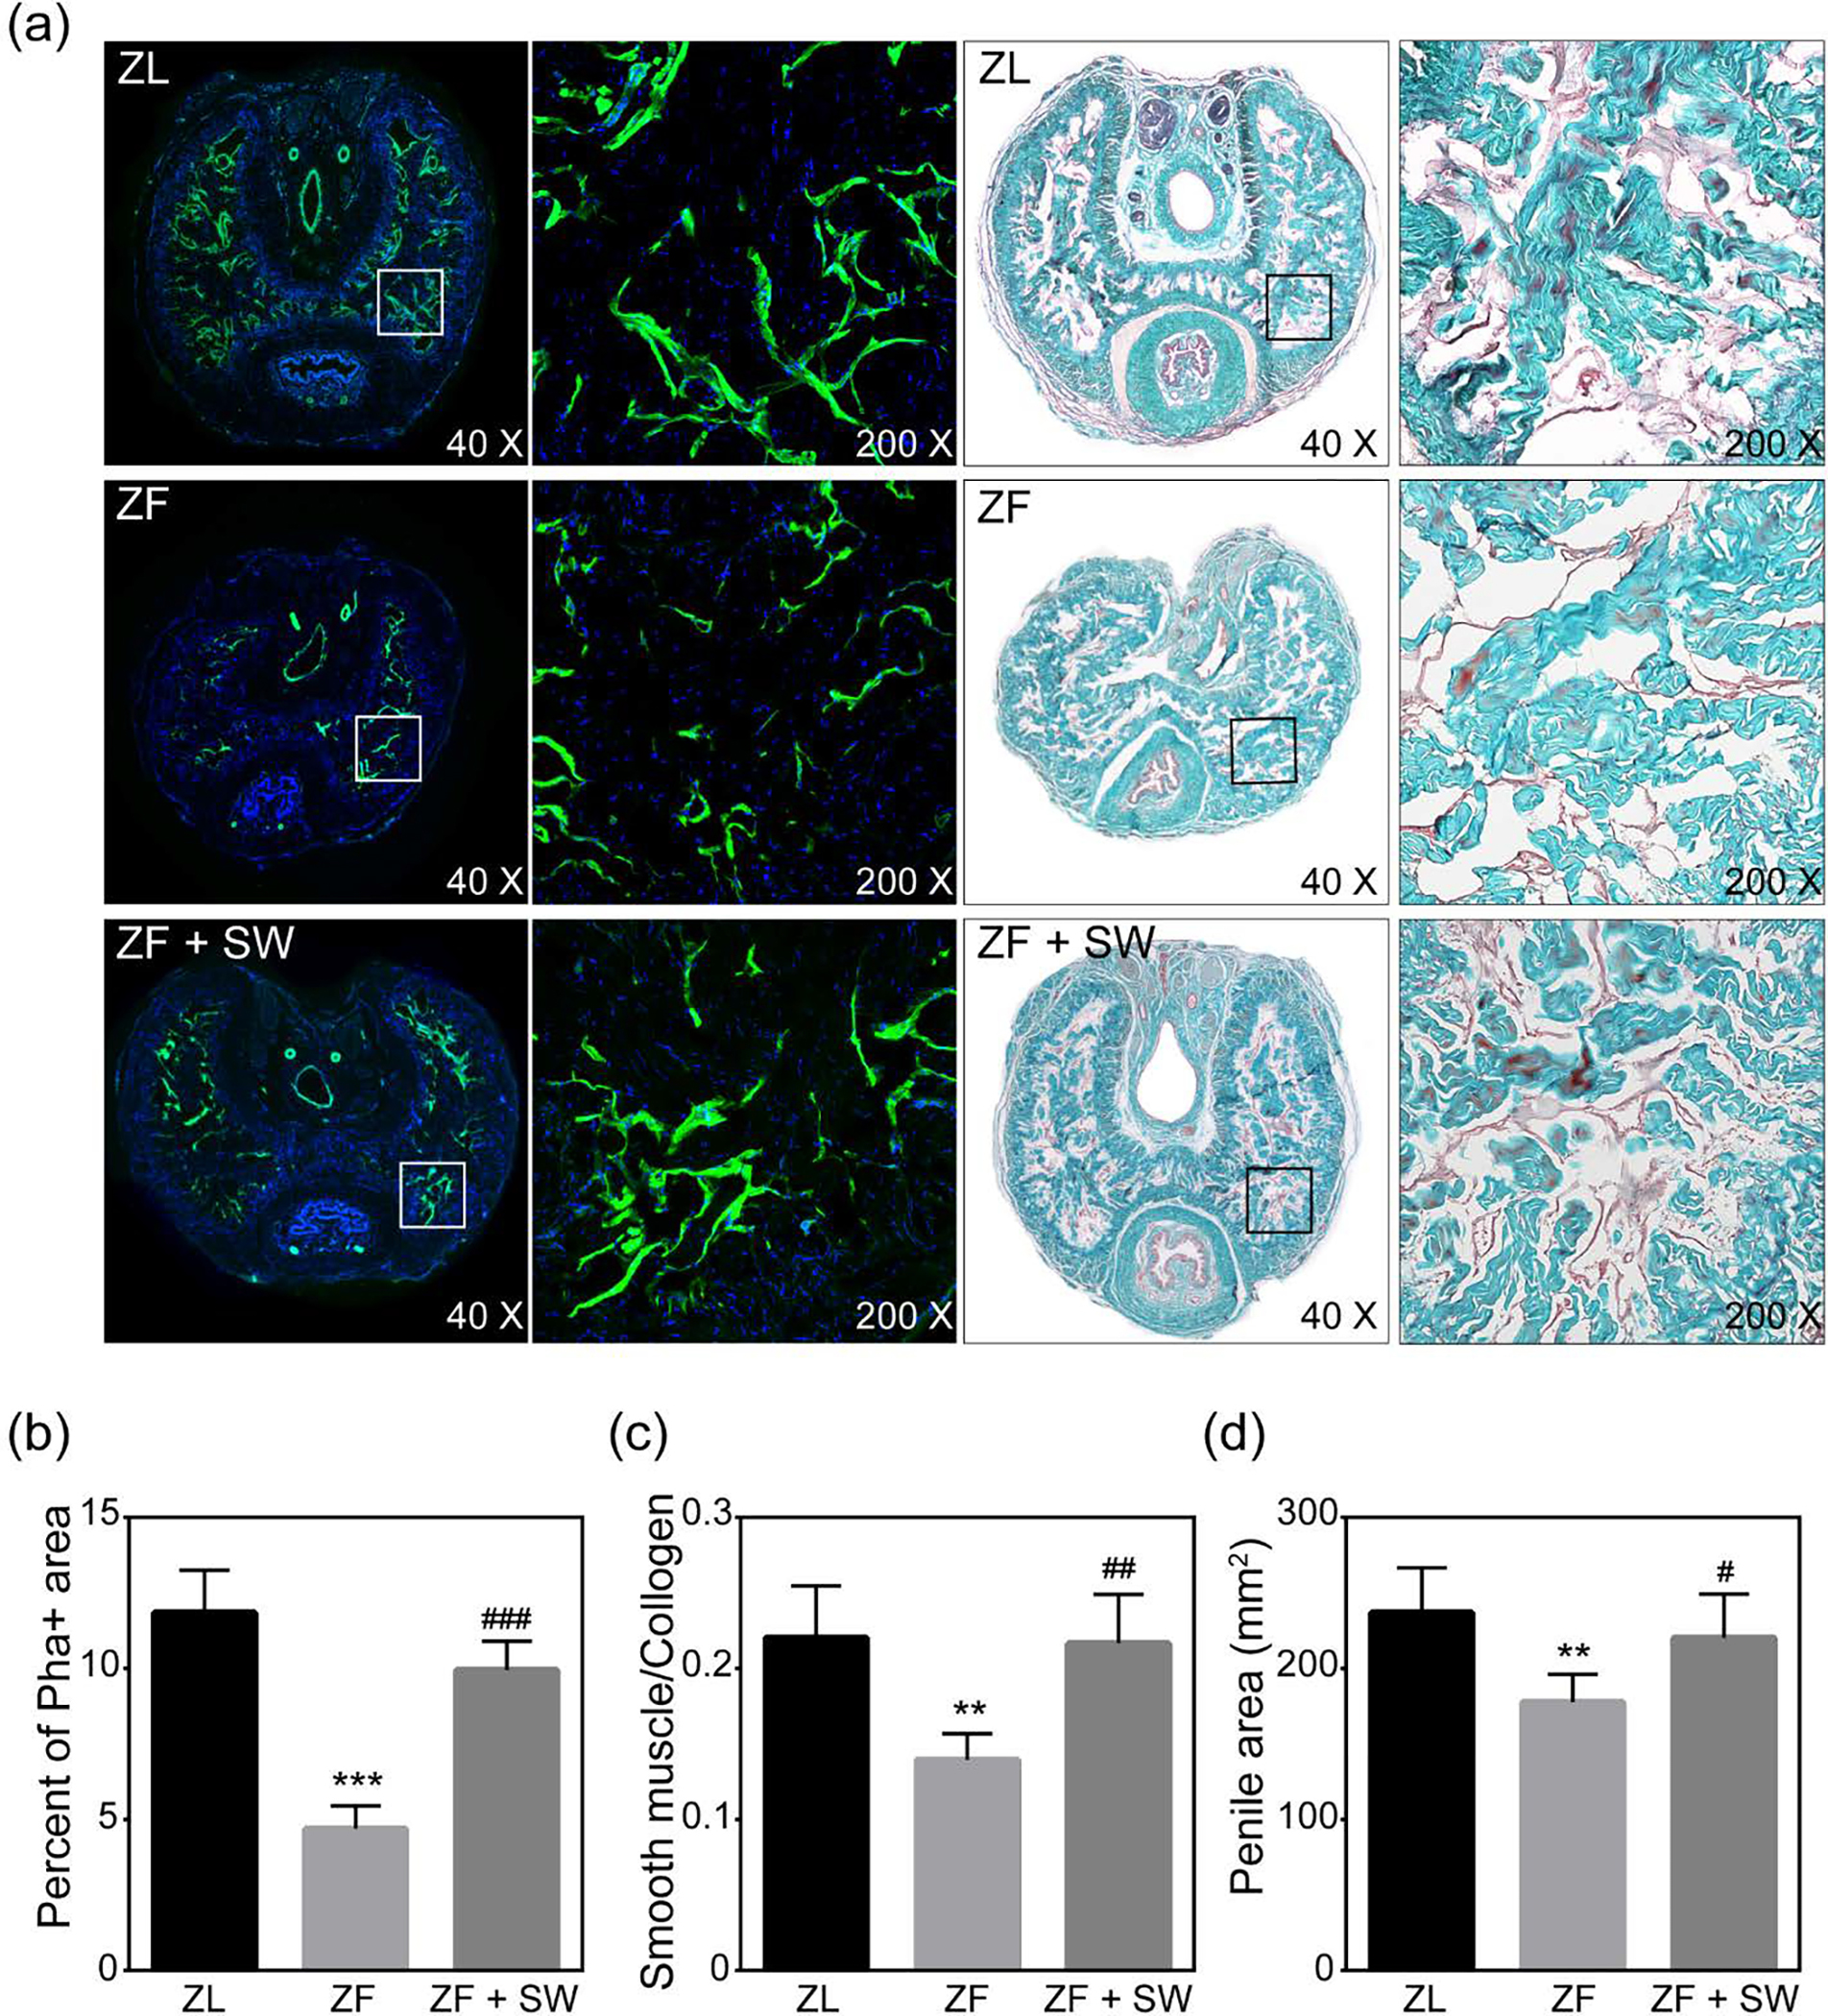
Figure 3.

Phalloidin staining and Masson’s trichrome staining of penile mid-shaft specimens. (a) Representative images of smooth muscle stained with Alexa Fluor 488 phalloidin (green) and Masson’s trichrome staining for ZL, ZF, and ZF + SW groups. The rectangle indicates the area selected for amplification. Original magnification, X40 and X200. (b) Smooth muscle content as a percentage of total intra-tunical area. (c) Effect of Li-ESWT treatment on the ratio of smooth muscle to collagen in the corpus cavernosum. (d) Area of the penile tissue cross section for the three groups. * P <0.05; ** 0.01 < P <0.05; *** P <0.01 compared with the ZL group; # P <0.05; ### P < 0.01 compared with the ZF group.
