
Figure 5.
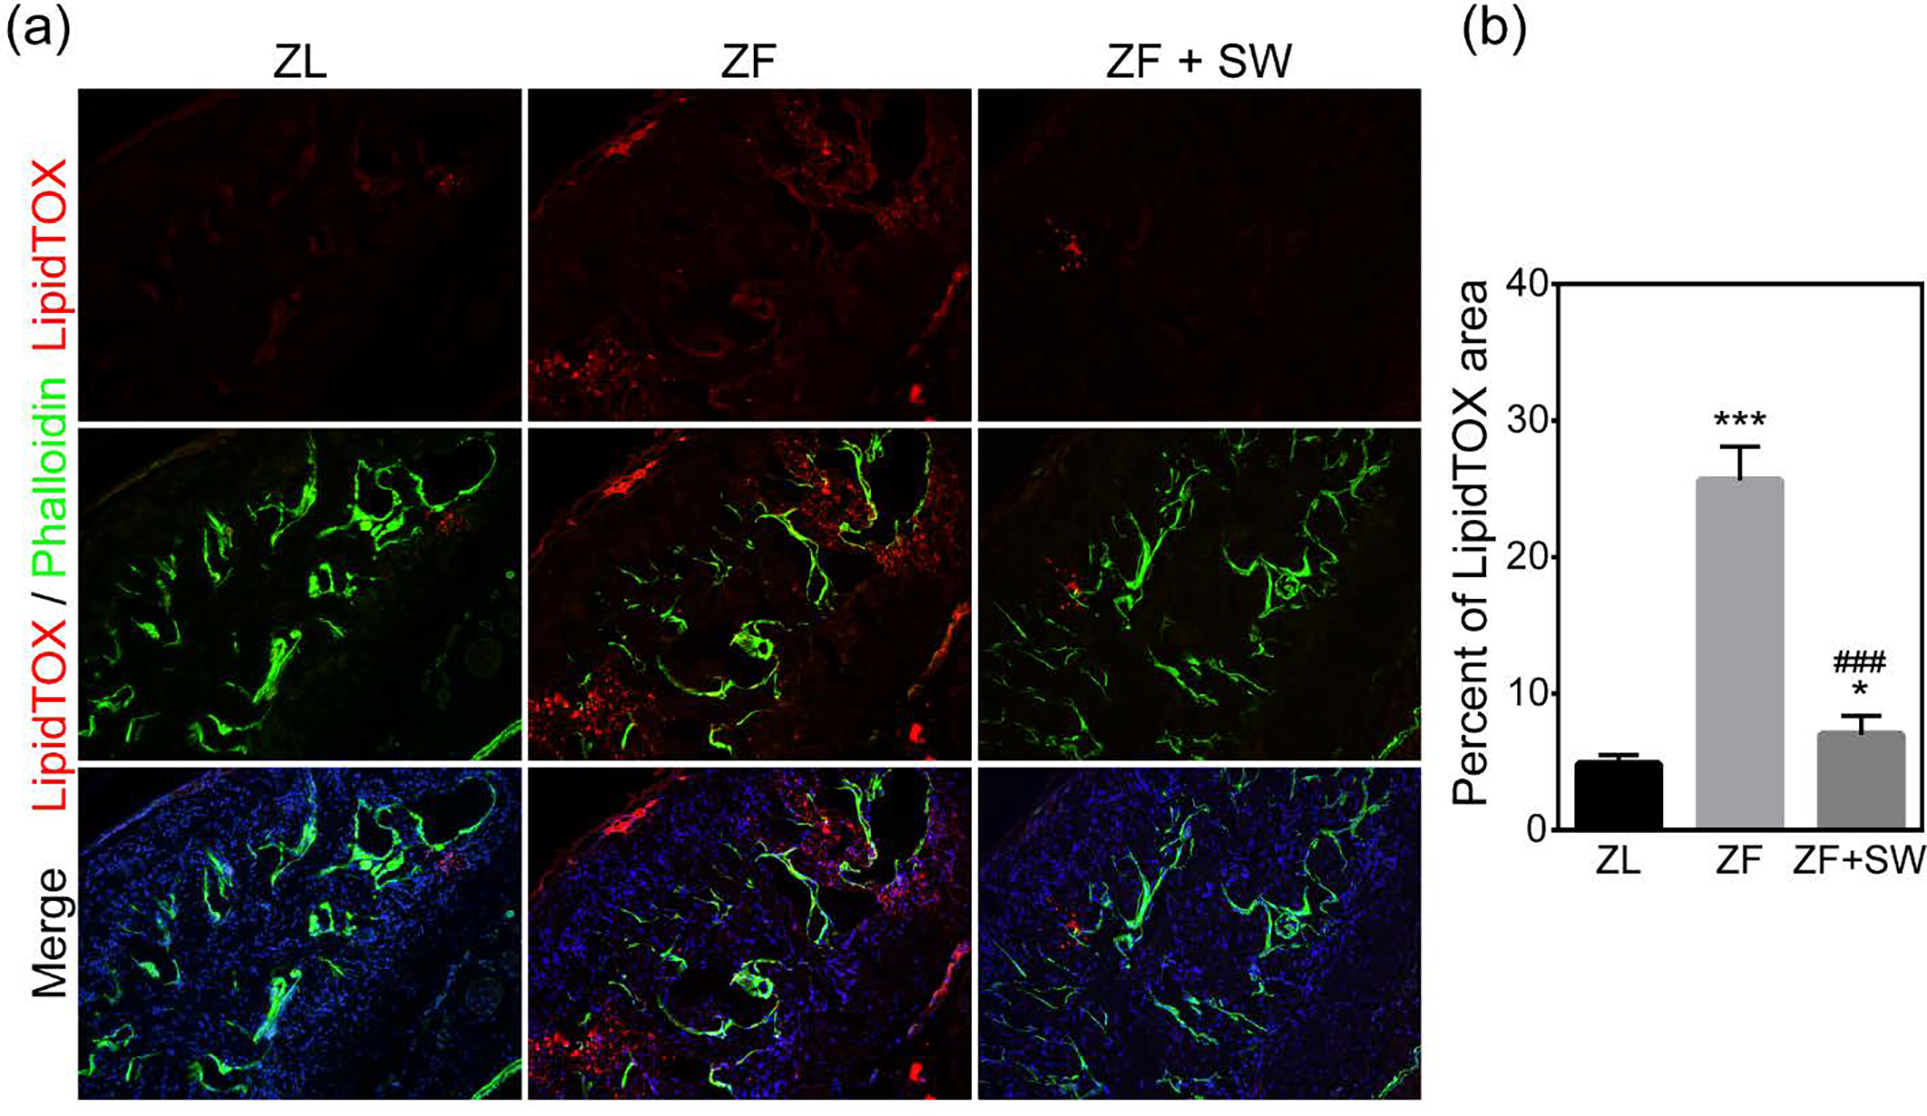
Lipid accumulation in the corpus cavernosum for ZL, ZF, and ZF + SW groups. (a) Representative images of LipidTOX (red) and smooth muscle stained with phalloidin (green). Original magnification, X100. (b) Quantification of LipidTOX in the whole section. * P < 0.05, *** P < 0.01 compared to the ZL group; ### P < 0.01 compared to the ZF group.