
Figure 6.
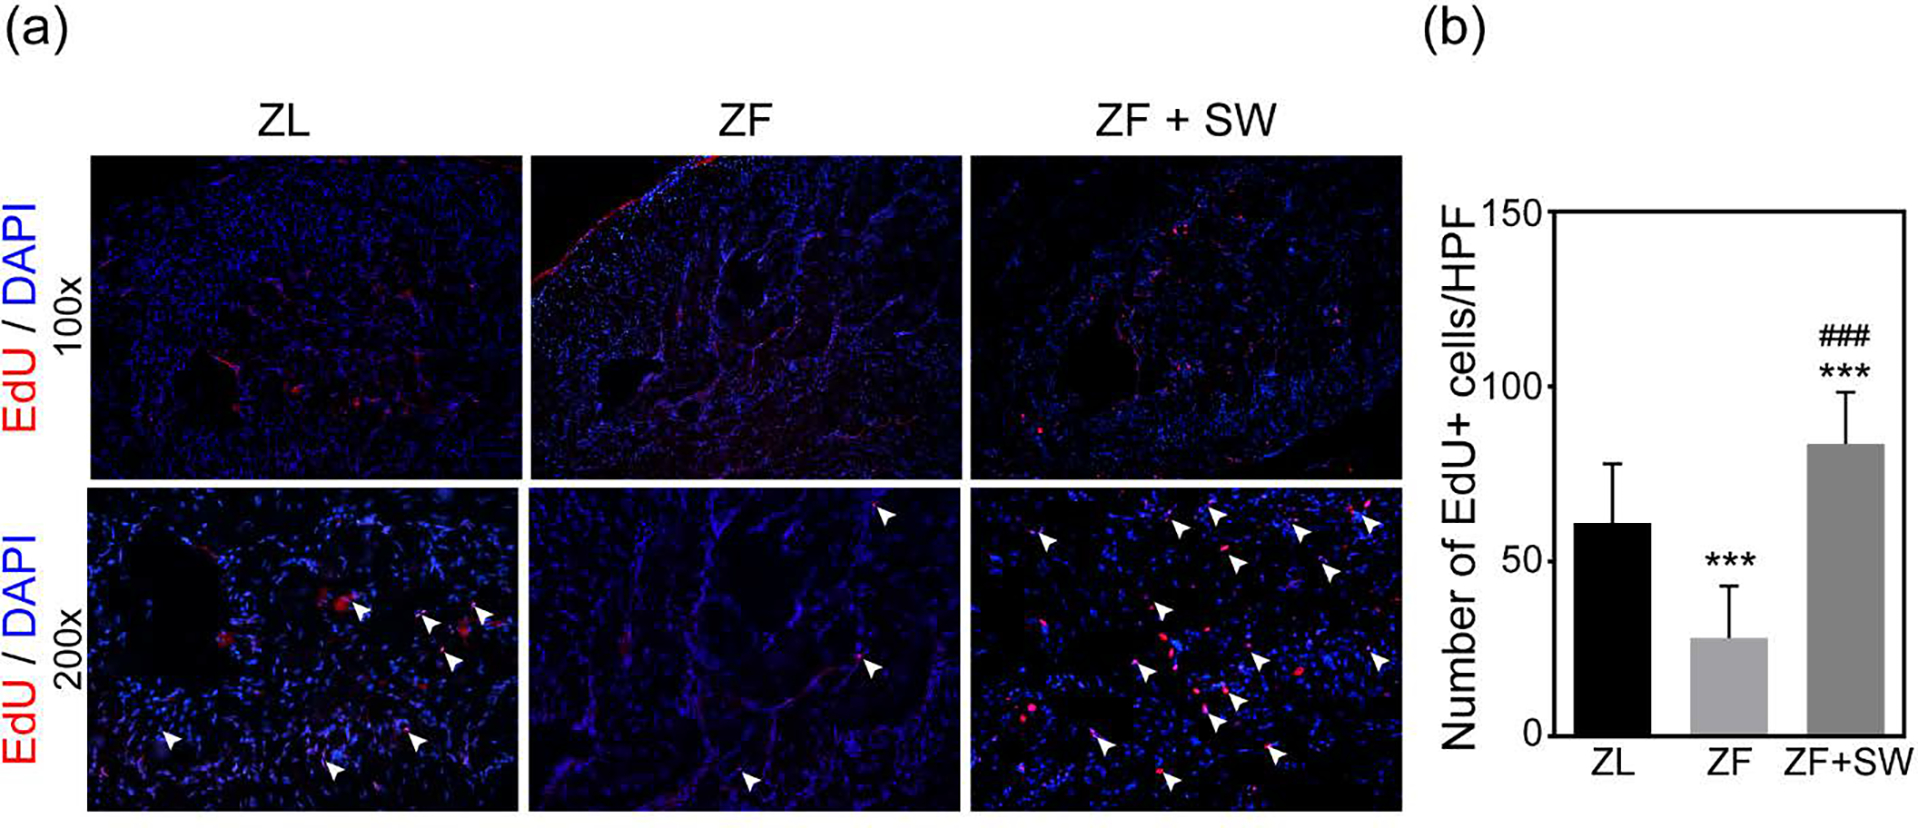
Evaluation of label-retaining cells (LRCs). (a) Representative images of EdU+ cells (red) in the corpus cavernosum for ZL, ZF, and ZF + SW groups. Original magnification, X100 and X200. (b) Total number of EdU+ cells/HPF in all groups. *** P < 0.01 compared to the ZL group; ### P < 0.01 compared to the ZF group.