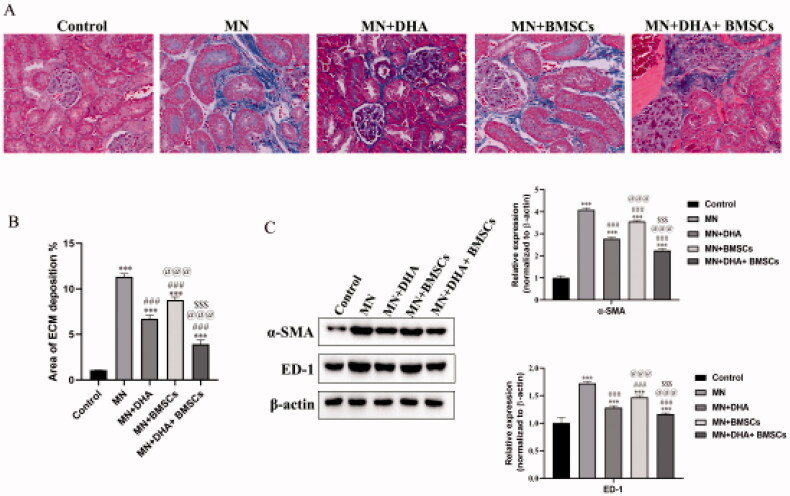
Figure 4.
Effects of combination therapy with DHA and BMSCs on renal fibrosis in MN mice. (A) Representative sections of kidney stained with Masson’s trichrome (original magnification ×400). (B) Area of ECM deposition in the kidney. (C) Western blot of α-SMA and ED-1 expression in the kidney. Values are expressed as the mean ± SD, n = 5 per group. ***p < .001 versus control group; ###p < .001 versus MN model group; @@@p < .001 versus MN + DHA group; $$$p < .001 versus MN + BMSCs group.

