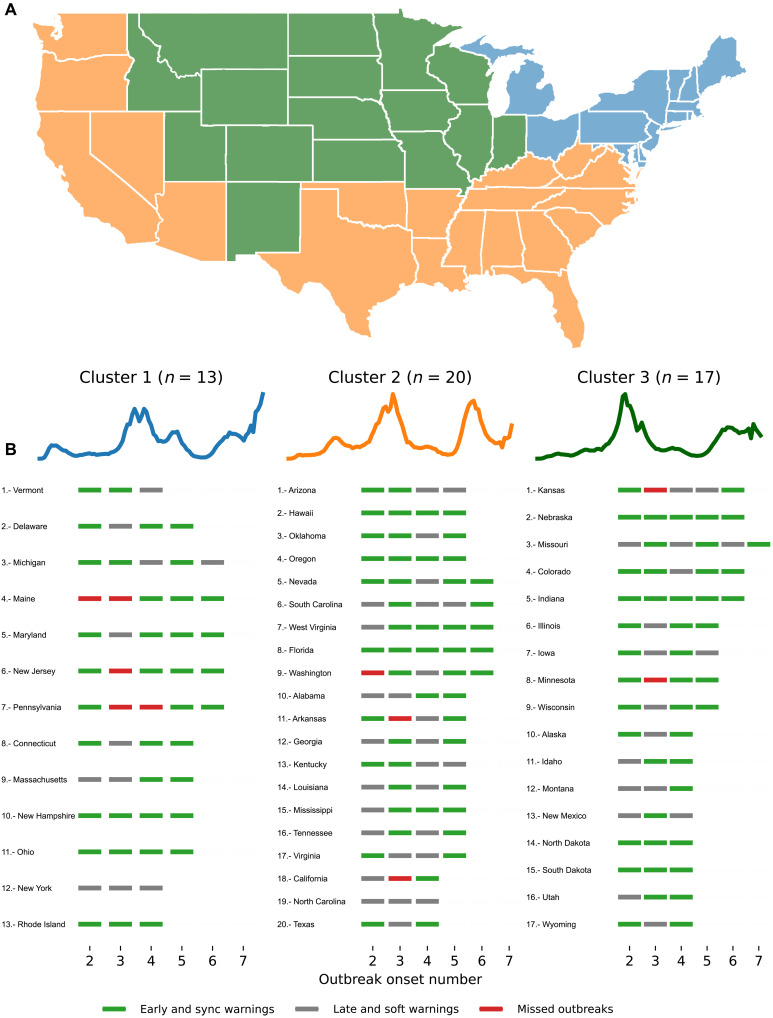
Fig. 4. Clustering analysis at the state level based on COVID-19–confirmed case trajectories.
(A) The geographical map color codes each location based on their cluster. A total of three clusters describe groups of states that experienced their first outbreak onset early in 2020 (cluster 1 in blue), during summer (cluster 2 in yellow), and late in 2020 (cluster 3 in green). (B) The set of blue, magenta, and gray markers corresponds to the performance of the Multiple Source method for each out-of-sample outbreak onset.

