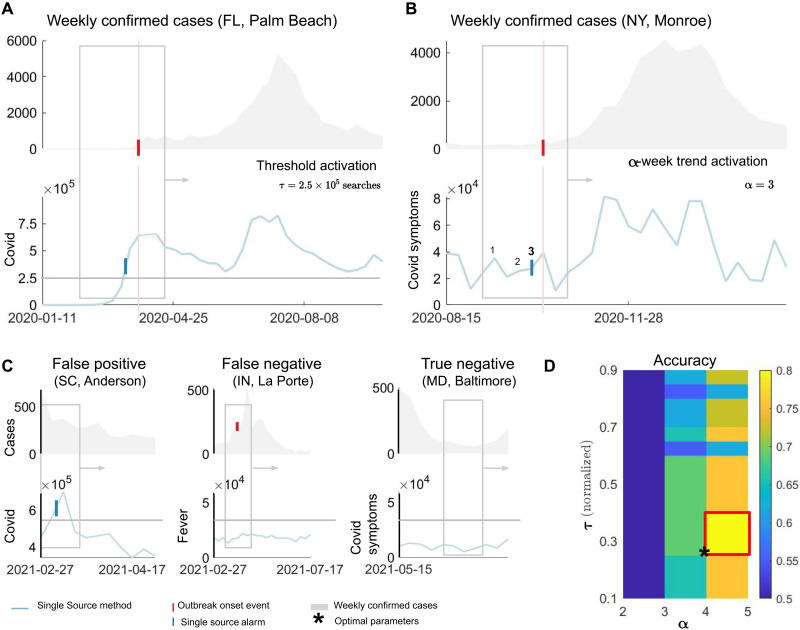
Fig. 6. An EWS for COVID-19 based on single sources (Single Source method).
A moving window spans both predictor (Google Trends for the term COVID) and COVID-19 cases. A threshold activation occurs when a predictor signal crosses the value τ. In the example, τ = 2.5 × 10⁵ Google searches for Palm Beach County (FL). The blue tick denotes the week of crossing. The red vertical tick and line denote the week of the outbreak onset event. (B) If a number α of increases happen in the predictor signal, an α-week trend activation takes place. In the example, α = 3 triggers an alarm for Monroe (NY) county preceding the outbreak onset event. Both (A) and (B) represent true positive (TP) events. (C) Definitions of false positive (FP), false negative (FN), and true negative (TN) events. (D) For the training step, we evaluate the performance of our Single Source method for different thresholds τ (normalized by the maximum of the signal on the training period) and α values for the α-week trend activation. A colormap with the training accuracy shows the highest rate for τ and α. The example illustrates optimal parameters τ and α as the lowest values such that accuracy is maximized, indicated by an asterisk in the lower leftmost corner of the red rectangle.

