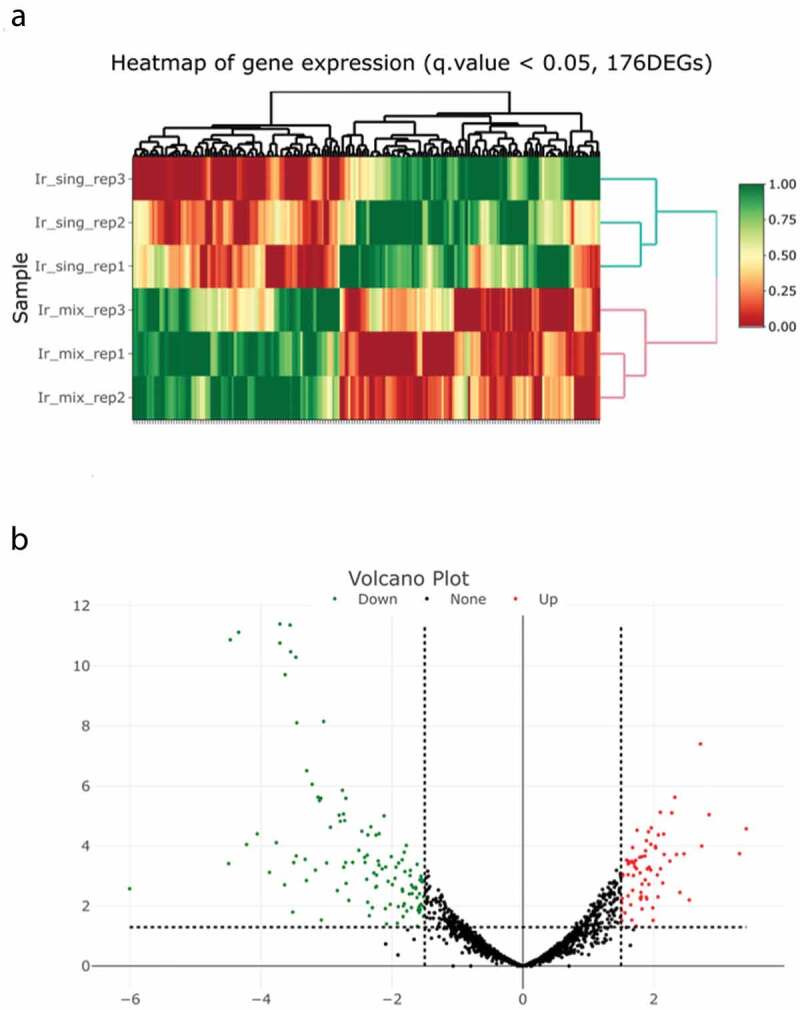
Figure 3.

Genes differentially expressed between cocultured and monocultured Fusobacterium nucleatum. (a) Hierarchical clustering of differentially expressed genes at a false discovery rate (FDR) of <0.05 between cocultured and monocultured F. nucleatum. Ir_sing: monocultured, Ir_mix: cocultured, red to green color scale indicates the relative level of gene expression. (b) Volcano plots show differentially expressed genes (p < 0.05, FDR <0.05). Horizontal dotted lines show the p-value cut-off of 0.05, and vertical dotted lines show the expression level log2 (fold change) cut-off of 1.5. Red and green dots indicate upregulated and downregulated, respectively.
