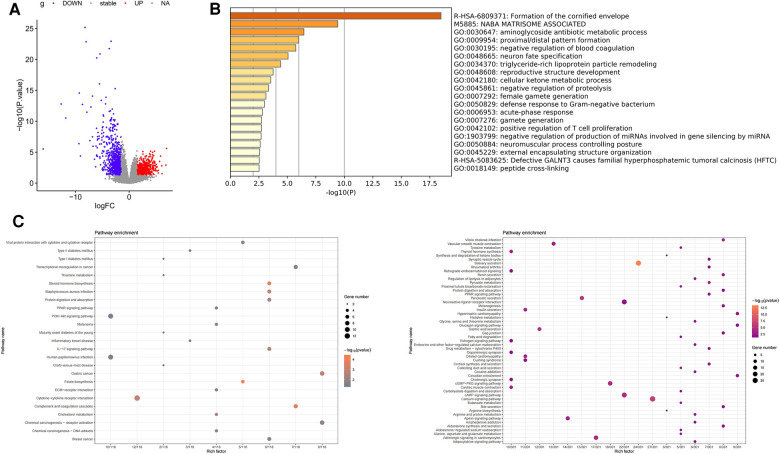
Figure 3.
Differential expression analysis of TSCC in the TCGA database. (A) Volcano map representing DEGs of TSCC in the TCGA database, with red representing upregulated genes and blue representing downregulated DEGs. (B) Results of pathway enrichment analysis of upregulated differentially expressed genes using Metascape. (C) Pathway enrichment analysis of DEGs; the left represents the enrichment of the upregulated gene KEGG pathway, and the right represents the enrichment of the downregulated gene KEGG pathway.

