
FIGURE 3.
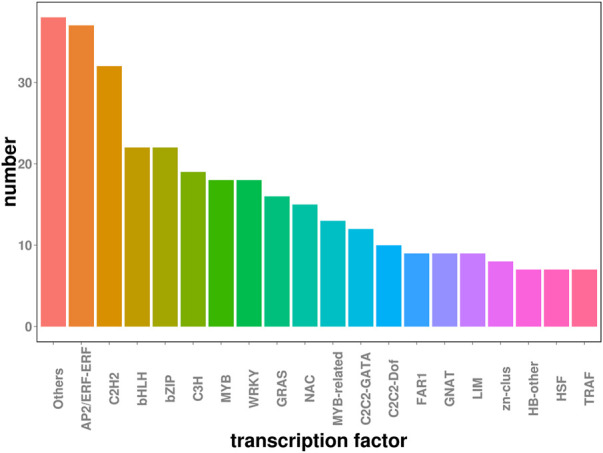
Identification of TFs in DEGs. The horizontal axis represents the names of transcription factors and the vertical axis lists the number of transcription factors.
Official websites use .gov
A
.gov website belongs to an official
government organization in the United States.
Secure .gov websites use HTTPS
A lock (
) or https:// means you've safely
connected to the .gov website. Share sensitive
information only on official, secure websites.
Identification of TFs in DEGs. The horizontal axis represents the names of transcription factors and the vertical axis lists the number of transcription factors.