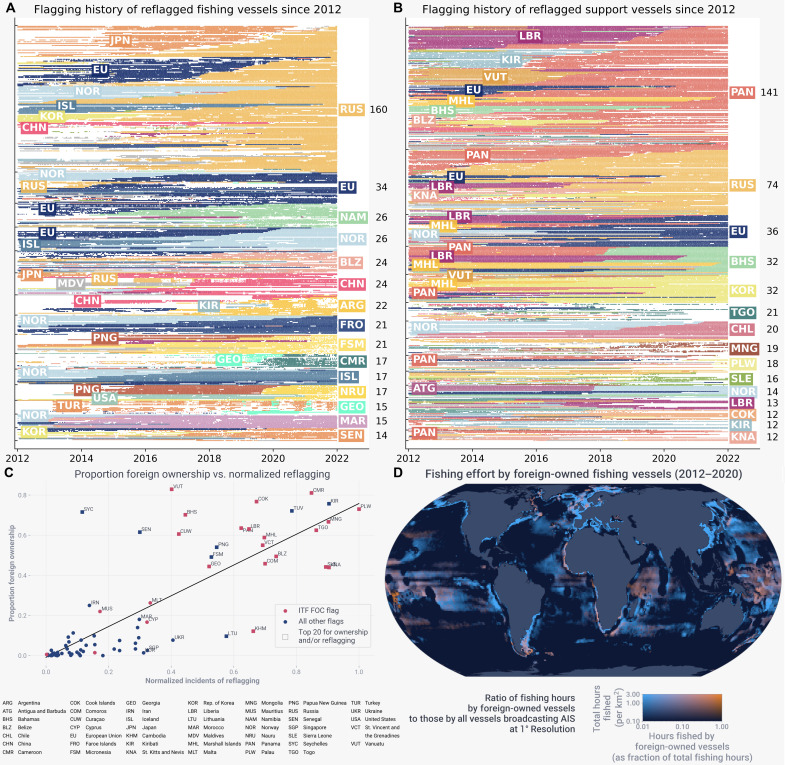
Fig. 3. Patterns of reflagging.
As of 1 January 2022, flagging history of (A) fishing and (B) support vessels flying the top 15 flags each by the number of vessels. Each horizontal line with dots corresponds to a vessel hull, and each dot represents whether the vessel was active in a given week. Each dot is color-coded by flag that the vessel flies at a given time between 2012 and 2021. On the right are ISO-3166 country codes of the top 15 flags, and the numbers next to them indicate the number of vessel hulls. European Union Member States are grouped together under EU. (C) Regression analysis of the proportion of foreign ownership for a flag versus incidents of reflagging normalized by the number of distinct vessels (R2 = 0.65). Only the top 50% of flags by the number of identities registered to that flag from 2012 to 2020 are included. Flags of convenience reported by the ITF are in red, and flags in the top 20 for either foreign ownership or reflagging are marked as squares. (D) Number of estimated hours fished by vessels with foreign owners as a proportion of the total fishing.

