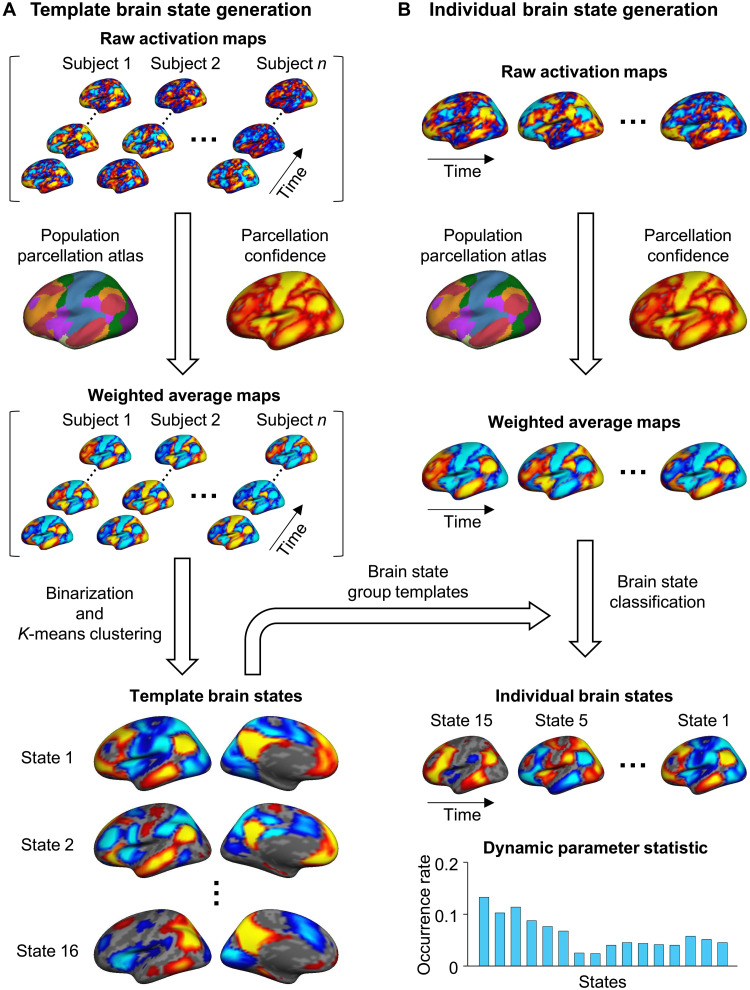
Fig. 1. Schematic of the INSCAPE approach.
(A) The group templates of brain coactivation states were generated using a resting-state fMRI dataset containing 846 healthy subjects from the GSP (Dataset I) (76). Specifically, the preprocessed fMRI data of each subject were projected to the FreeSurfer fsaverage4 surface space, which has 2562 vertices per hemisphere. For each time frame of BOLD data, the raw activation map was weighted by the parcellation confidence derived from a population-based cortical parcellation (82) and averaged within each of the 48 network patches (24 per hemisphere). The mean activations of the 48 patches were then binarized (i.e., values larger than 0 were set to 1 and values smaller than 0 were set to −1) to represent the mean weighted coactivation maps that were then concatenated along with the time series across all subjects. A k-means clustering analysis was then performed to classify the fMRI frames into 16 clusters. The optimal cluster number of 16 was selected on the basis of results from the test-retest reliability analysis (see fig. S1) because it balanced the test-retest reliability with the diversity of the brain states. Last, the maps of fMRI frames assigned to the same cluster were averaged to generate the group templates for the 16 dynamic brain states. (B) At an individual subject level, the maps of the preprocessed fMRI data were first weighted by the parcellation confidence and averaged within the 48 patches using the same procedure described above for group template generation. Each patch map was then assigned to one of the 16 template brain states having the shortest spatial distance to it. The occurrence rate of each brain state was calculated as the percentage of frames assigned to a given brain state out of the total number of frames.

