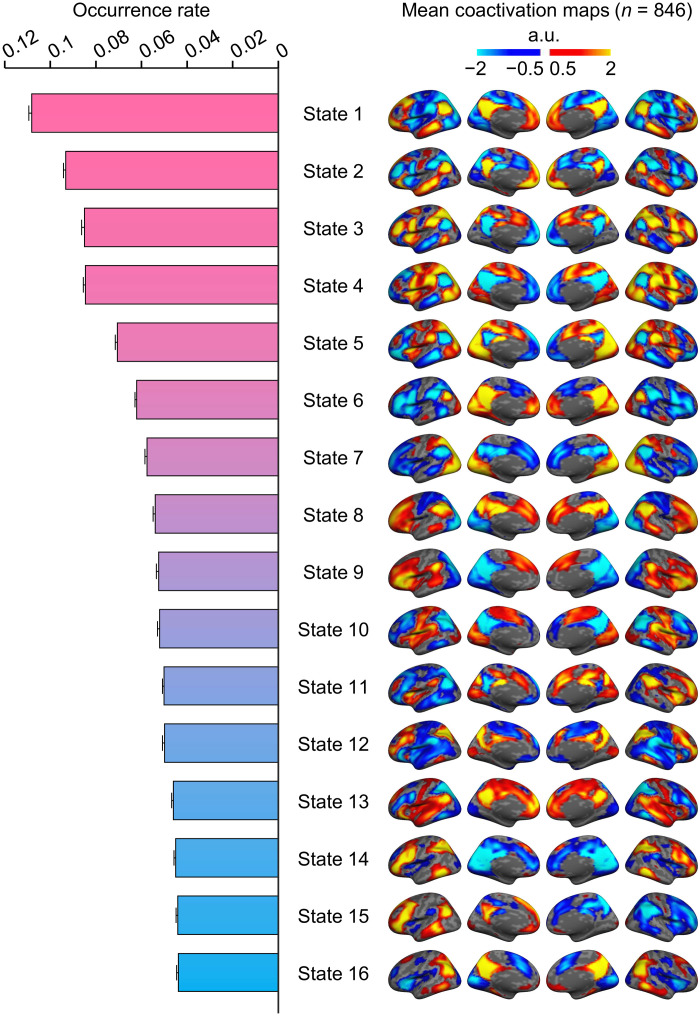
Fig. 2. Occurrence rate and spatial maps of the 16 coactivated brain states.
The group templates of brain coactivation states were computed using the INSCAPE approach across 846 healthy individuals from the GSP dataset. The group-level brain state coactivation maps were generated by averaging the fMRI time frames assigned to the same cluster across subjects and ranking them by their rate of occurrence in descending order. Of the 16 brains states, states 1 through 4 showed canonical DN activation and had the highest occurrence rates across subjects during resting state. a.u., arbitrary units.

