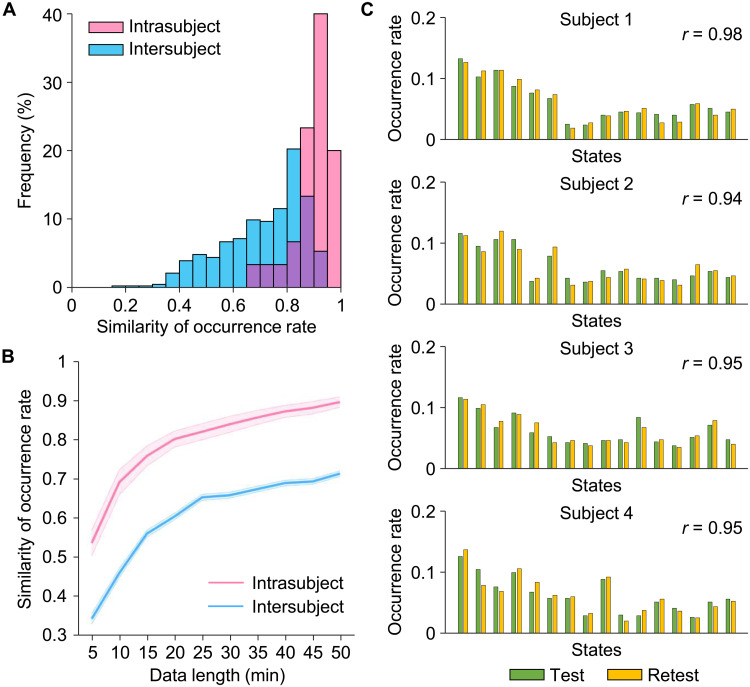
Fig. 3. Estimation of the reliability of the INSCAPE analysis.
(A) Test-retest reliability was evaluated using the CoRR-HNU dataset (i.e., Dataset II). We divided each subject’s data equally into two 50-min sessions and calculated the occurrence rates for each session. The intra- and intersubject similarities were quantified by estimating the correlation coefficient of occurrence rates within the same subject and between any two individuals. Correlation analyses yielded a mean intrasubject similarity of r = 0.90 and a mean intersubject similarity of r = 0.71. The frequency distributions of occurrence rates are depicted in a histogram with intrasubject and intersubject similarity denoted by pink bars and blue bars, respectively. (B) The intrasubject (pink line) and intersubject (blue line) similarities in occurrence rates were also examined using the test-retest dataset with 10 different data lengths ranging from 5 to 50 min in duration, in 5-min time increments (mean intrasubject test-retest reliability ± SEM, 5 min: 0.54 ± 0.03, 10 min: 0.69 ± 0.03, 15 min: 0.76 ± 0.03, 20 min: 0.80 ± 0.02, 25 min: 0.82 ± 0.02, 30 min: 0.84 ± 0.02, 35 min: 0.86 ± 0.02, 40 min: 0.87 ± 0.02, 45 min: 0.88 ± 0.02, 50 min: 0.90 ± 0.01). The shaded areas in the figure represent the standard errors. (C) Histograms showing the distributions of test-retest occurrence rates for the 16 brain states extracted from four randomly selected individuals taken from the CoRR-HNU dataset. Green bars represent the occurrence rate of brain states in the test session, while yellow bars represent the occurrence rate of brain states in the retest session.

