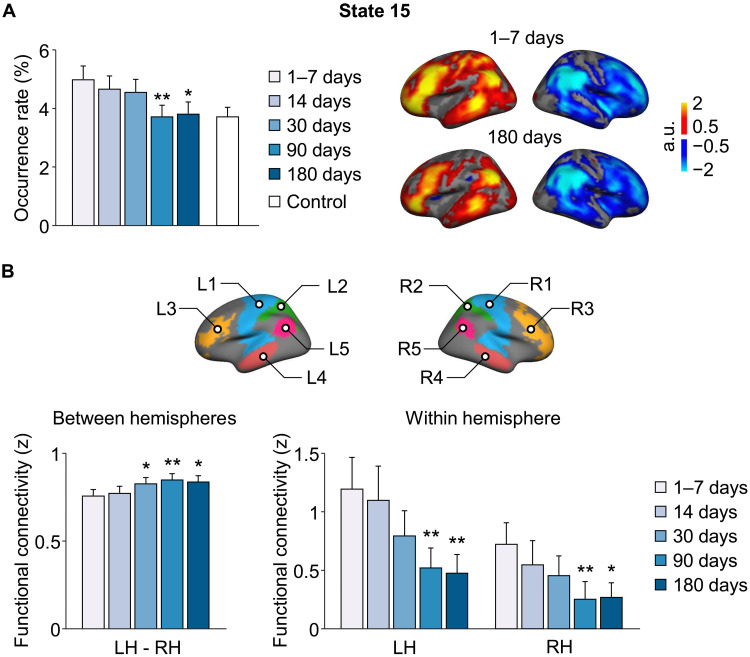
Fig. 6. Longitudinal changes of brain states in patients with subcortical stroke during the first 6 months of recovery.
(A) The occurrence rates of the 16 brain states were estimated in patients with subcortical stroke at five time points over a 6-month period (i.e., 1 to 7, 14, 30, 90, and 180 days after stroke). The bar graph shows the mean occurrence rate of state 15 (±SEM) in the patient group (n = 42; blue bars) at each successive time point and in the healthy control group (n = 23; white bars). There was a significant reduction in the occurrence of left-lateralized state 15 in stroke patients at the 90 and 180 days poststroke time points relative to baseline (1 to 7 days after stroke) (paired t test, *P < 0.05 and **P < 0.01). The coactivation maps of left-lateralized brain state 15 in patients at 1 to 7 days and 180 days after stroke are displayed in the right. (B) Five left-hemispheric patches (L1: sensorimotor, L2: superior parietal lobule, L3: lateral prefrontal cortex, L4: middle temporal gyrus, and L5: angular gyrus) that had the highest activations in brain state 15 at the 1 to 7 days poststroke time point and five symmetric right-hemispheric patches (R1, R2, R3, R4, and R5) were selected for the estimation of between- and within-hemisphere connectivity. Between-hemisphere FC increased at the 30, 90, and 180 days poststroke time points relative to baseline (paired t test, *P < 0.05 and **P < 0.01). Both hemispheres showed a gradual reduction in the within-hemisphere connectivity over the 6-month period, and the reduction was statistically significant at 90 and 180 days after stroke compared to the baseline (paired t test, *P < 0.05 and **P < 0.01). LH, left hemisphere; RH, right hemisphere.

