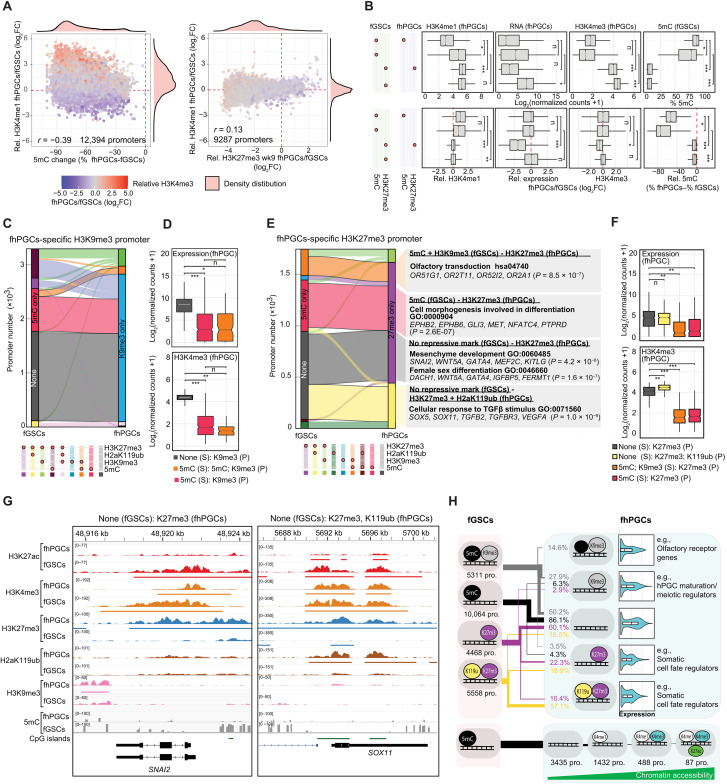
Fig. 4. Epigenetic compensation for 5mC loss in the germ line.
(A) Correlation between differential promoter DNA methylation and H3K4me1 levels (left) or differential H3K27me3 and H3K4me1 levels (right) in fhPGCs and fGSCs. Color code indicates differential H3K4me3 levels between fhPGCs and fGSCs. Pearson correlation coefficient is shown. Promoters co-occupied by H3K27me3 and 5mC were excluded. (B) Absolute (top) and relative levels (fhPGCs/fGSCs; bottom) of expression and occupancy with indicated epigenetic marks at promoters harboring the indicated epigenetic modifications in fGSCs and fhPGCs. Promoters co-occupied by H3K27me3 and 5mC in fhPGCs or fGSCs were excluded. Wilcoxon effect size is depicted. (C) Repressive epigenetic marks in fhPGCs and fGSCs at promoters with fhPGCs-specific H3K9me3 occupancy. (D) Expression and H3K4me3 levels of fhPGCs-specific H3K9me3 promoters in fhPGCs. Color code indicates epigenetic modifications in fhPGCs (P) and fGSCs (S). Wilcoxon effect size is depicted. (E) Repressive epigenetic states of fhPGCs-specific H3K27me3 promoters in wk9 fhPGCs and fGSCs (left). GO terms enriched within depicted promoter groups (right). (F) Expression and H3K4me3 levels of fhPGCs-specific H3K27me3 promoters in fhPGCs. Color code indicates epigenetic modifications in fhPGCs (P) and fGSCs (S). Wilcoxon effect size is depicted. (G) Genome browser view of the SNAI2 and SOX11 locus showing the indicated epigenetic modifications in fhPGCs and fGSCs. (H) Top: Comparison of repressive epigenetic promoter states in fGSCs and fhPGCs (black = 5mC; gray = H3K9me3; violet = H3K27me3; yellow = H2aK119ub). Most prominent repressive promoter states in fGSCs and the corresponding epigenetic promoter states and their expression in fhPGCs are shown. Bottom: Epigenetic states of hypomethylated promotes in fhPGCs, harboring no repressive modification (black = 5mC; white = H3K4me1; opal = H3K4me3; green = H3K27ac). Effect size levels as in Fig. 1.

