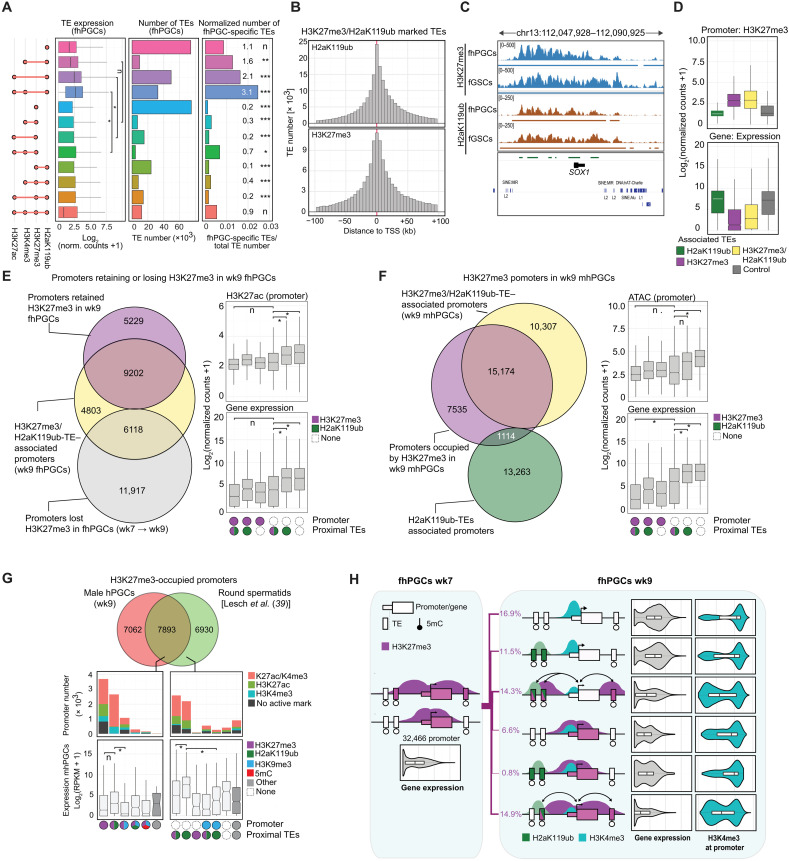
Fig. 6. Association of H2aK119ub/H3K27me3 occupied TEs and promoters.
(A) Expression (Wilcoxon effect size) and size of the indicated TE subgroups (left). Normalized number of fhPGC-induced TEs (Enrichment rates and chi-square goodness-of-fit effect size of fhPGC-induced TEs are shown; right). (B) Distribution of H3K27me3 and H2aK119ub occupied TEs in relation to the nearest genic TSS (±100 kb to TSS). (C) Genome browser view of the SOX1 locus in fhPGCs and fGSCs depicting H2aK119ub and H3K27me3 occupancy. (D) Expression and H3K27me3 level of genic promoters associated with TEs occupied by H3K27me3, H2aK119ub, a combination of both, or neither (control) in fhPGCs. (E) Overlap of genic promoters that lost (gray) or retained (violet) H3K27me3 between wk7 and wk9 in fhPGCs with H3K27me3/H2aK119ub-TE–associated promoters (left). Expression and H3K27ac levels of promoters that lost (white) or retained H3K27me3 (violet) between wk7 and wk9 in fhPGCs and were associated with H3K27me3/H2aK119ub-TEs, H2aK119ub-TEs or neither (right). Wilcoxon effect size. (F) Overlap of genic H3K27me3-marked promoters (violet) with H3K27me3/H2aK119ub-TE (yellow) and H2aK119ub-TE–associated promoters (green) in wk9 in mhPGCs (left). Promoter expression and accessibility of the indicated promoter groups in wk9 mhPGCs (right). Wilcoxon effect size. (G) Overlap between promoters occupied by H3K27me3 in round spermatids [Lesch et al. (39)] and mhPGCs (top). Epigenetic state and expression in mhPGCs of promoters occupied by H3K27me3 specifically in round spermatids or both cell types (Wilcoxon effect size; bottom). (H) Schematic summarizing promoter activity and epigenetic state of promoter-proximal TEs. Promoters were occupied by H3K27me3 in wk7 fhPGCs and changed their epigenetic state in wk9 fhPGCs as indicated. For simplicity, promoters occupied by H2aK119ub and H3K27me3 in wk9 fhPGCs are not shown. Violin plots depict expression and H3K4me3 levels of the promoter groups in fhPGCs. Effect size levels as in Fig. 1.

