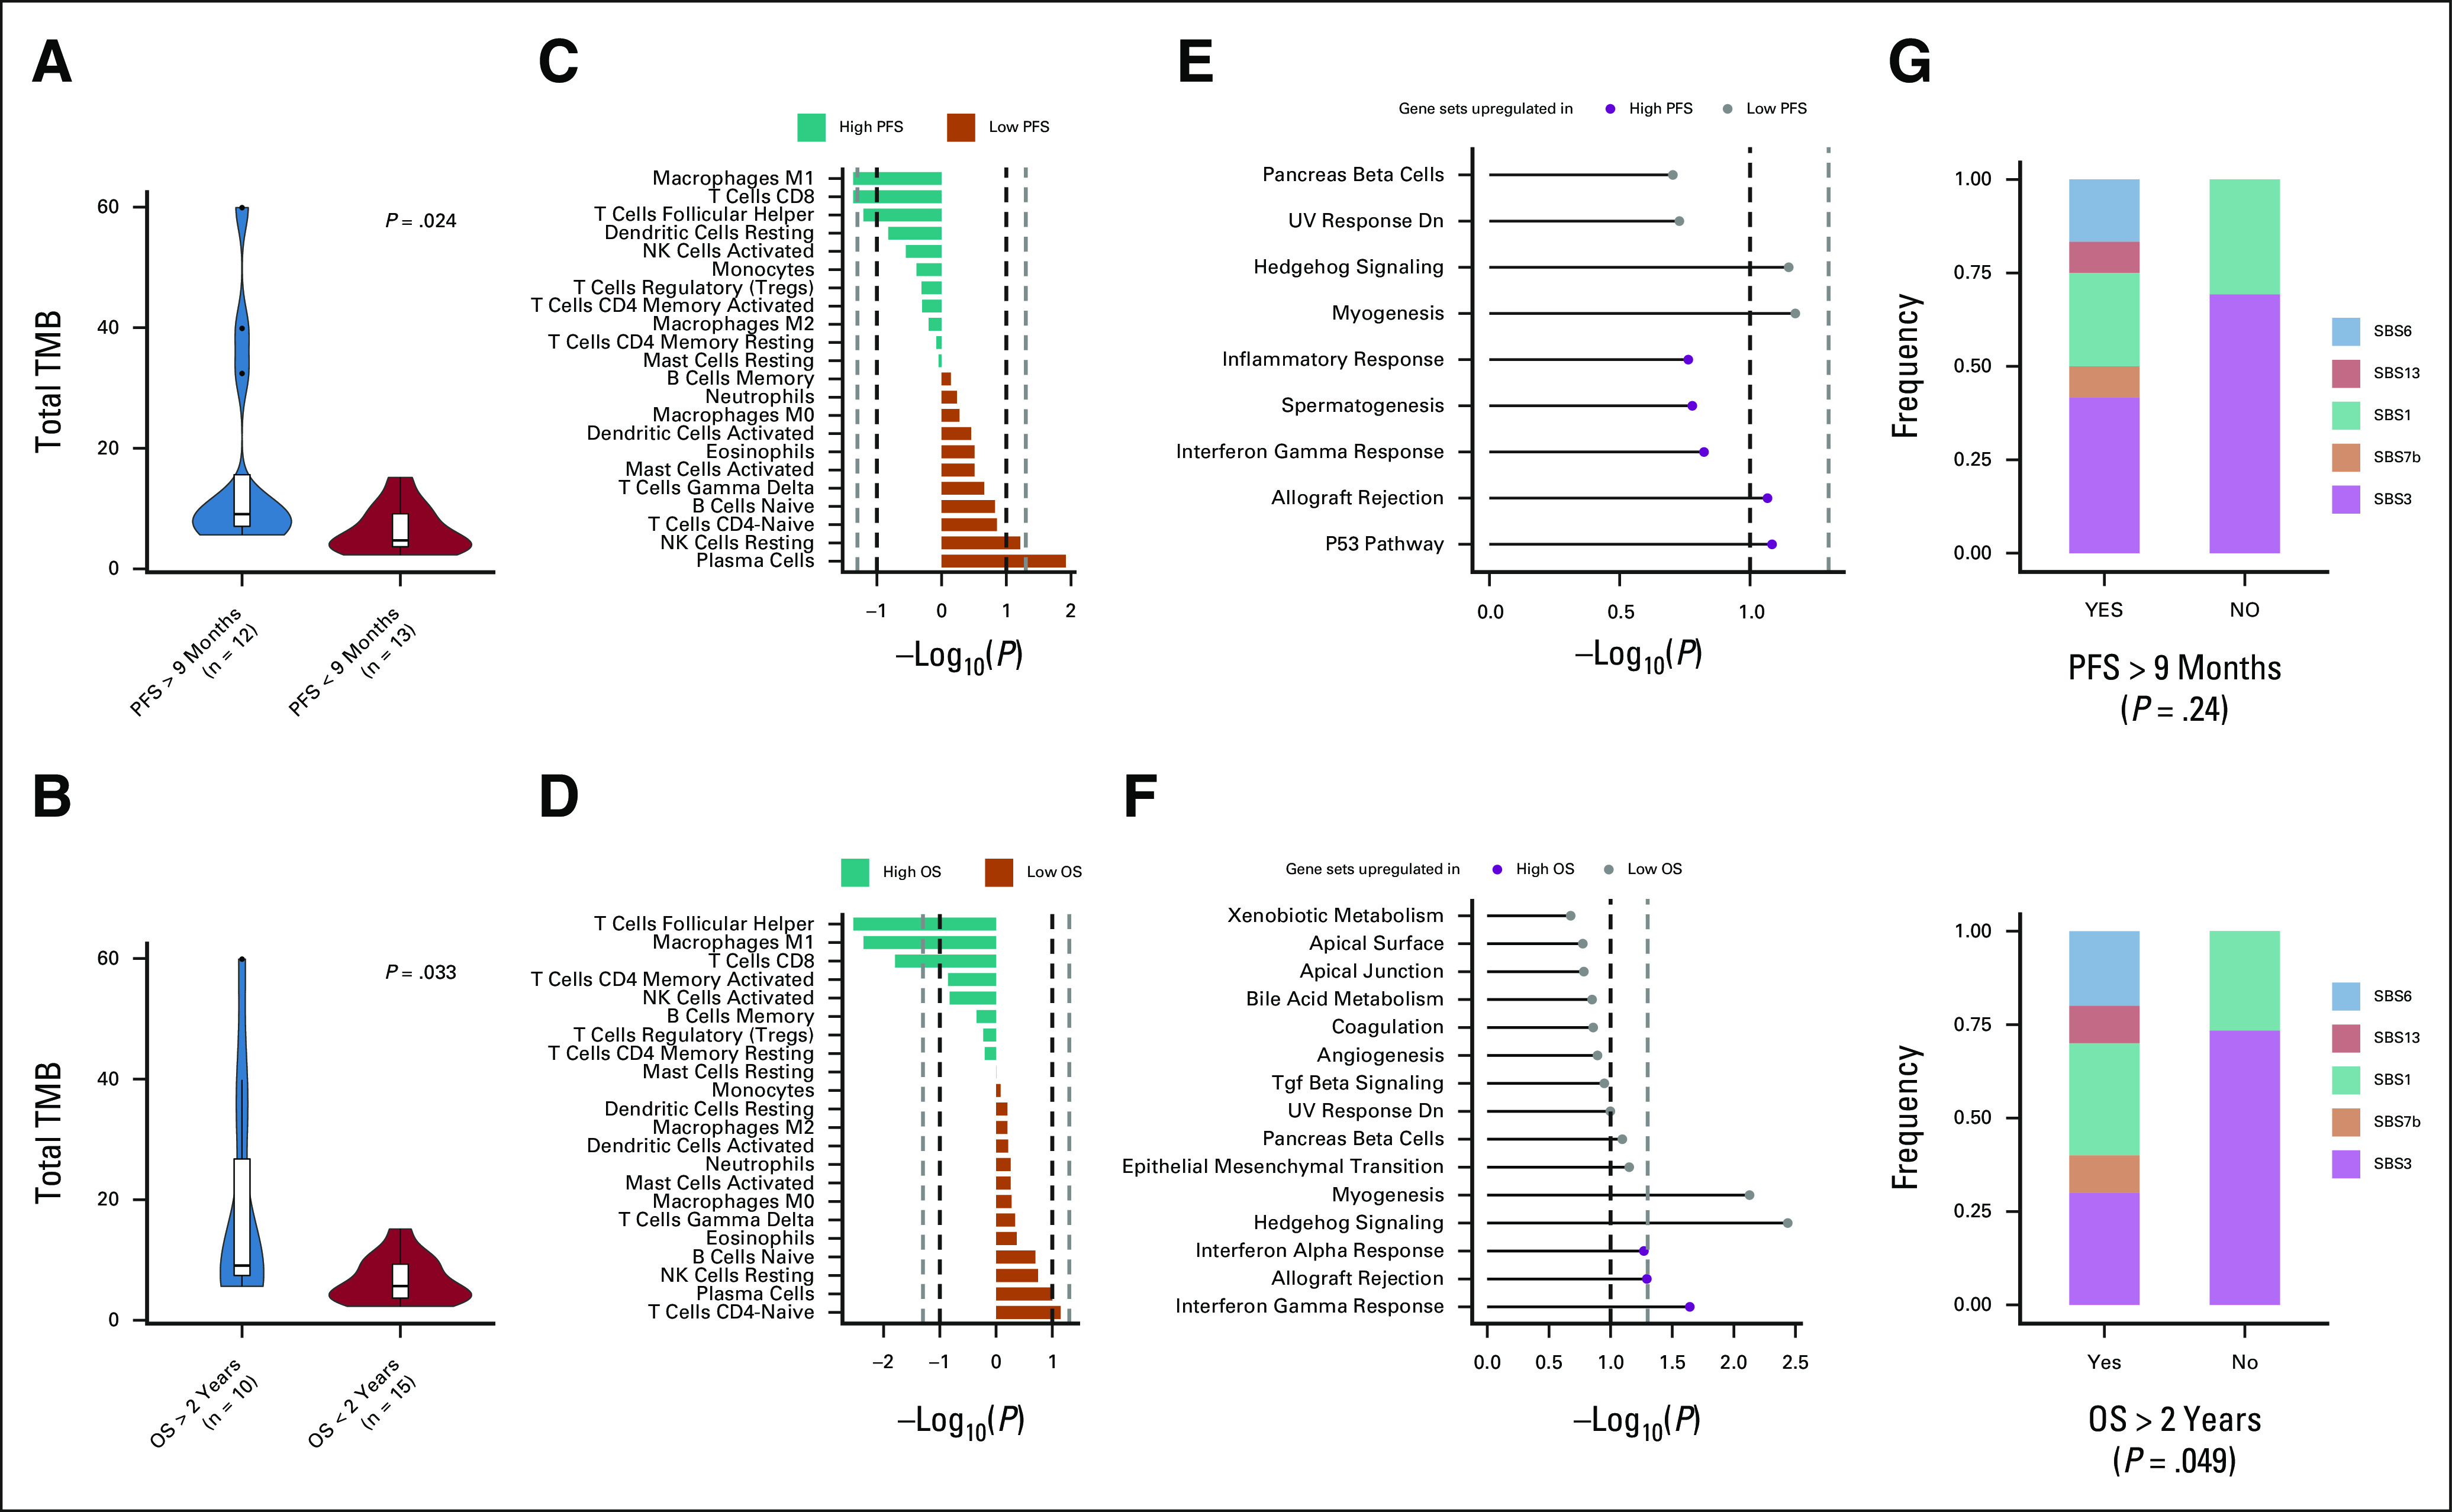
FIG 2.

Genomic differences between patients with high and low PFS (≥ 9 months v < 9 months) and high and low OS (≥ 2 years v < 2 years). (A) Median pretreatment TMB by PFS. (B) Median pretreatment TMB by OS. (C) Immune cell populations according to CIBERSORTx by PFS. (D) Immune cell populations according to CIBERSORTx by OS. (E) Hallmark gene sets (GSEA) enriched for each group by PFS. The dark and light vertical dotted lines correspond to P value thresholds of .1 and .05, respectively. (F) Hallmark gene sets (GSEA) enriched for each group by OS. (G) Defective HR DNA damage repair (SBS3) was identified as the dominant signature in a higher proportion of patients with poorer OS (bottom panel), but not PFS (top panel). GSEA, gene set enrichment analyses; HR, homologous recombination; OS, overall survival; PFS, progression-free survival; TMB, tumor mutational burden.
