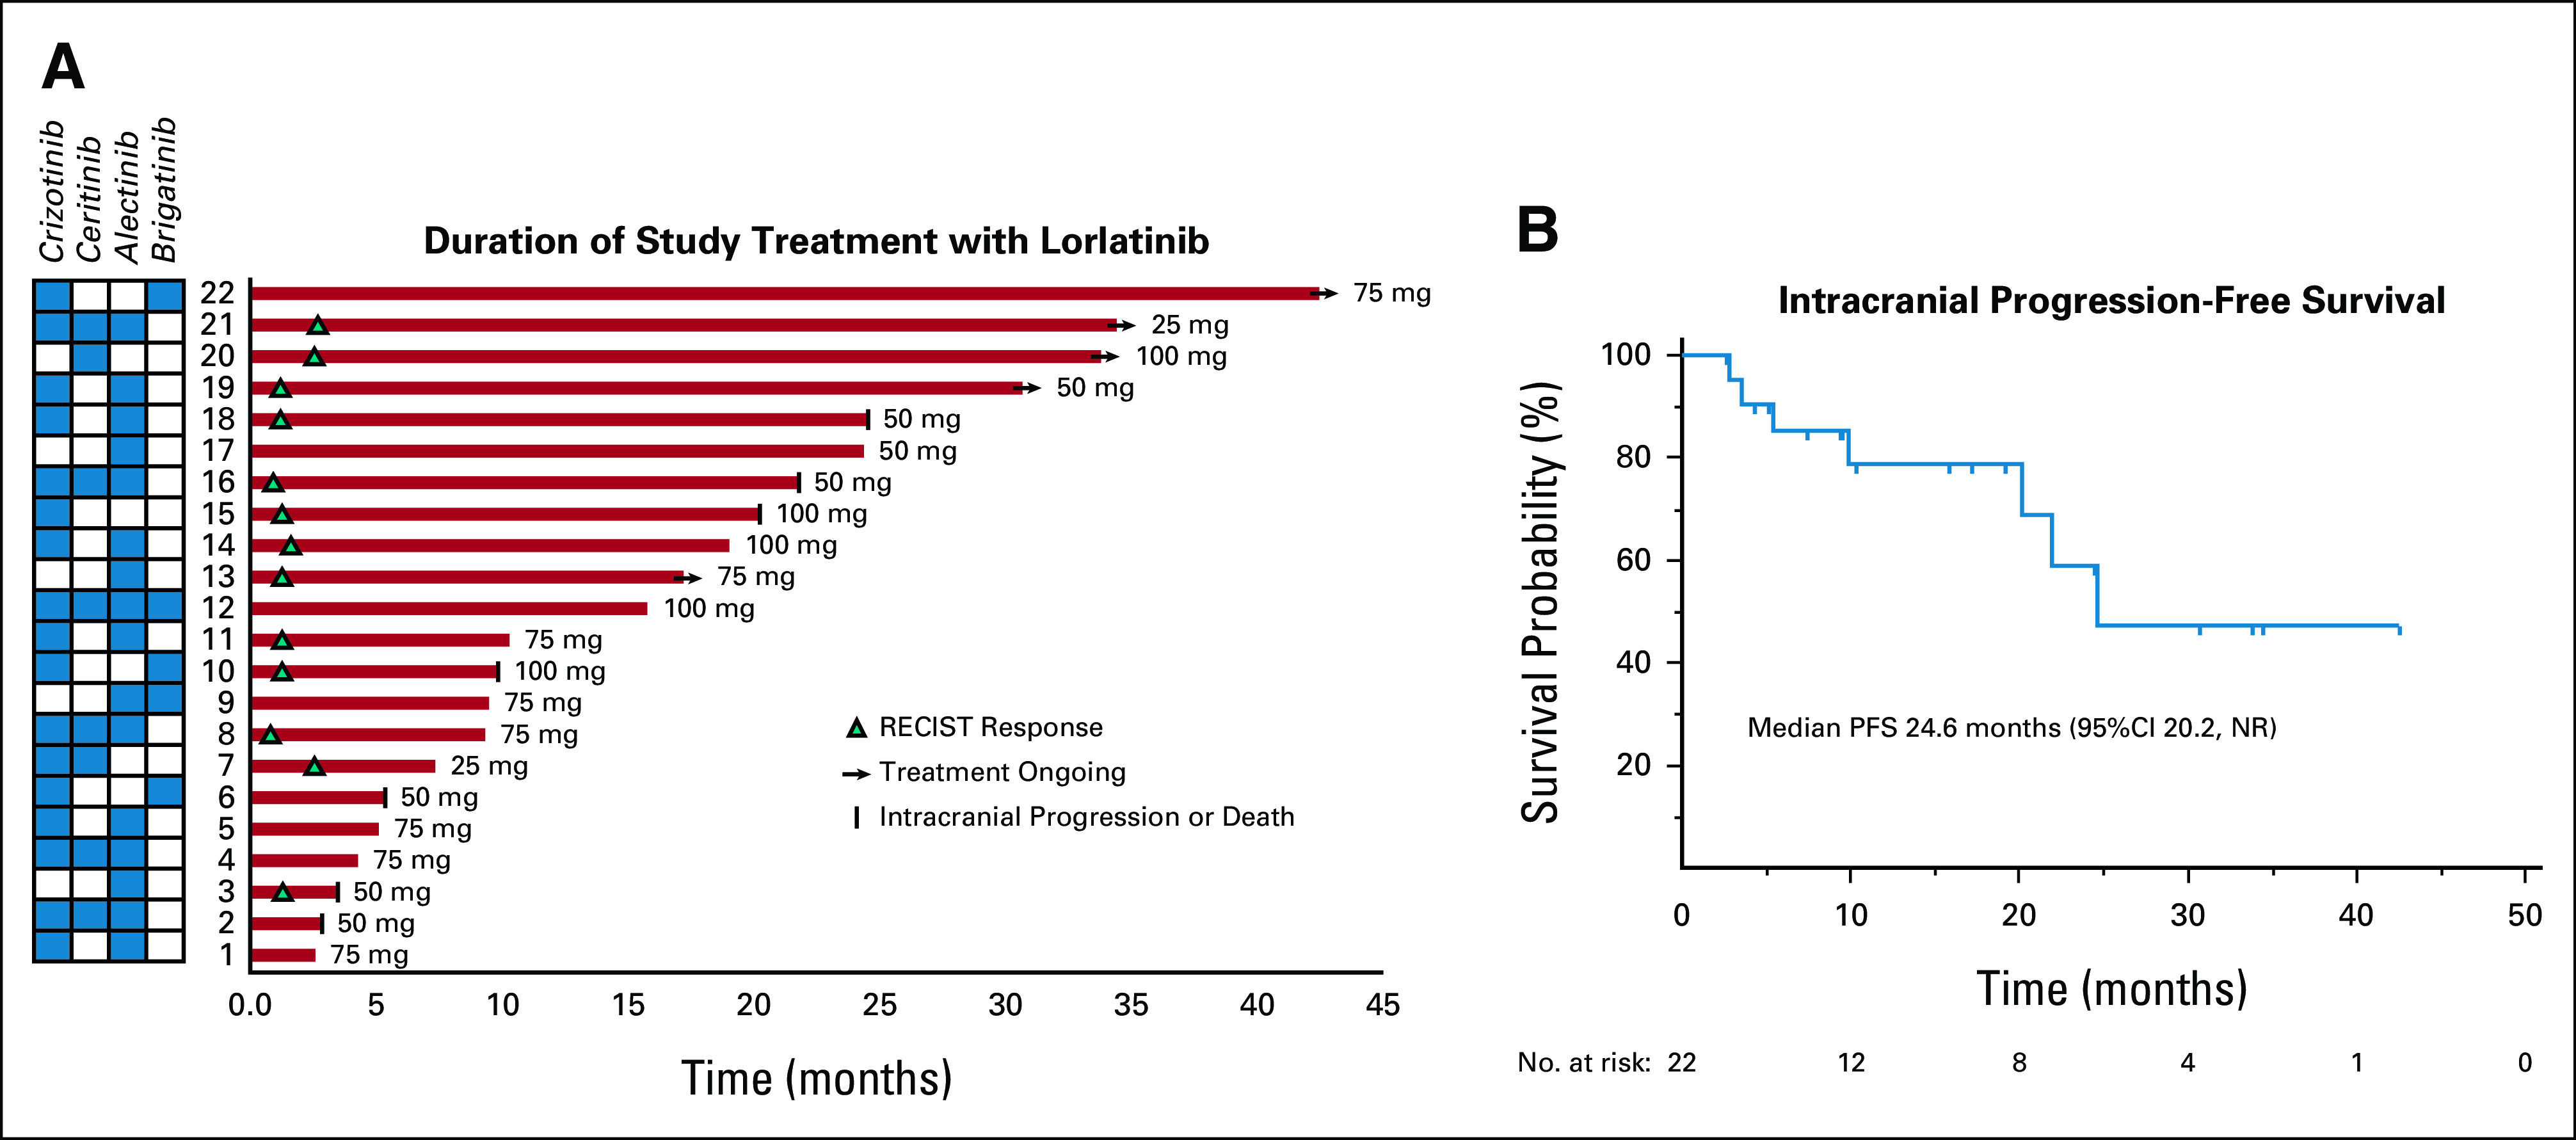
FIG 2.

Durability of intracranial responses to lorlatinib. (A) The swimmer plot illustrates the duration of treatment with lorlatinib. Minimum dose of lorlatinib received is indicated next to each patient. Intracranial response to treatment, patient and brain metastasis status, and lorlatinib treatment status are indicated with symbols (see the legend). ALK inhibitors received before lorlatinib are indicated in the grid. (B) The Kaplan-Meier curve illustrates intracranial PFS with lorlatinib. NR, not reached; PFS, progression-free survival.
