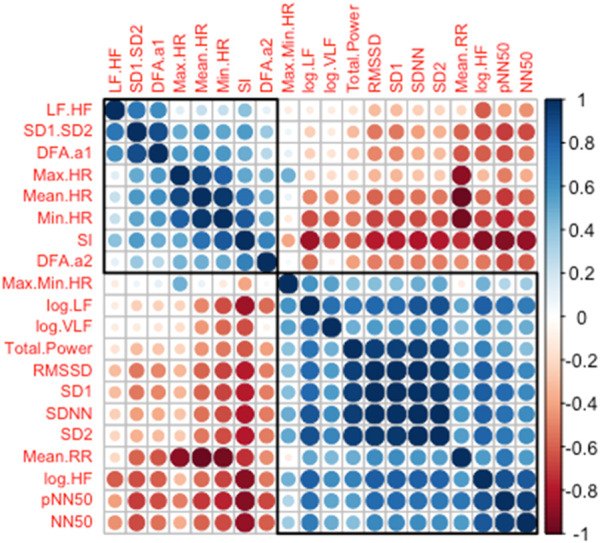
FIGURE 2.

Hierarchically clustered correlation matrix among the HR/HRV measures. The color and the size of the circles indicate the strength of correlation with blue shades indicating positive and red shades indicating negative correlations. The black squares on top-left and bottom-right show the grouping based on the similarity and dissimilarity of each variable roughly clustering into the PNS (bottom-right) and the SNS (top-left) groups. Abbreviations: LF.HF, Ratio of low frequency (LF) to high frequency (HF) band powers; SD1.SD2, Ratio of Poincaré Perpendicular Standard Deviation (SD1) to Poincaré Parallel Standard Deviation (SD2); DFAα1, short-term detrended fluctuation analysis; HR, Heart Rate; SI, Stress Index; DFAα2, long-term detrended fluctuation analysis; Max.Min HR, Heart Rate Range; VLF, Very-Low Frequency; RMSSD, Root Mean Square of Successive Differences; SDNN, Standard Deviation between R-R intervals; RR, R to R interval in ECG rhythm; pNN50, percentage of successive R-R intervals that deviate greater than 50 ms; NN50, number of R-R intervals that deviate greater than 50 ms.
