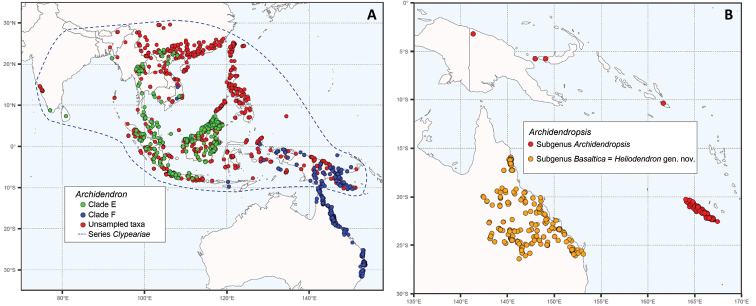
Figure 1.
Distribution maps of the genera Archidendron and Archidendropsis. The maps are based on quality-controlled species-level digitised herbarium specimens from GBIF (www.gbif.org) (Ringelberg et al. 2022). Maps were created using R packages ggplot2 (Wickham 2016), sf (Pebesma 2018), and rnaturalearth (South 2017) AArchidendron. Species distributions are coloured according to the ncDNA phylogeny clades (Fig. 2) except for A.clypearia: Clade E (Clypeariae clade) = green dots; clade F (Archidendron s.s. clade) = blue dots; species not sampled for the phylogeny = red dots. Archidendronclypearia is widespread and falls in both clades E and F, so for this species locations of samples in the ncDNA phylogeny are coloured according to their clade and all other records of this species are coloured red. The overall distribution of series Clypeariae is shown by a blue dashed line BArchidendropsis. All species that belong to subg. Archidendropsis are coloured red and those in subg. Basaltica (= Heliodendron gen. nov.) are coloured orange.

