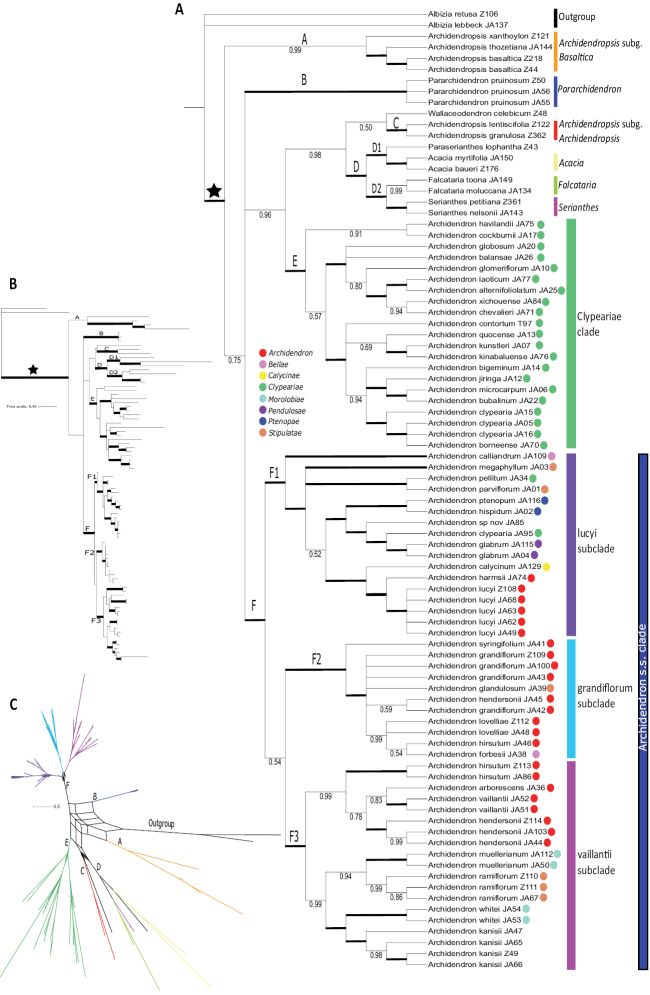
Figure 2.
Combined ncDNA phylogeny of the Archidendron clade. The Bayesian Inference (BI) cladogram, phylogram, and consensus network for the combined ncDNA dataset are presented A Cladogram: the star indicates the Archidendron clade sensu Koenen et al. (2020). Nodes with PP = 1.0 are shown in bold while other nodes with PP ≥ 0.50 are noted under the node. Clades are labelled with letters above the node. Coloured bars to the right of clades are names discussed in the text. Nielsen’s series of Archidendron are shown as coloured circles next to the sample name; key to colour and series in legend B Phylogram: clades are labelled as per A and nodes with a PP = 1.0 are shown in bold C Consensus network: branches are colour coded and labelled as per the clades of A.

