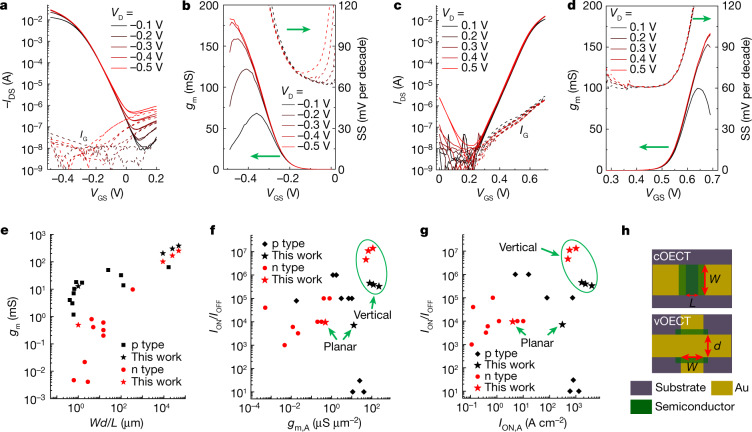
Fig. 2. OECT performance and comparison with literature data.
a–d, Representative transfer characteristics (a,c) and corresponding gm and SS curves (b,d) of p-type gDPP-g2T (W = d = 30 µm) (a,b) and n-type Homo-gDPP (W = d = 50 µm) (c,d) vOECTs. (L ≈ 100 nm). e, gm as a function of Wd/L for the present vOECTs and cOECTs as well as the previously reported OECTs7,8,14,15,21,23–32. Comparisons of current on/off ratio (ION/IOFF) versus gm per unit area (gm,A) (f) and on-current per unit area (ION,A) (g) for different v- and cOECTs. Note, different asterisks are data of this work based on different W and d (Extended Data Table 1). h, Cartoon illustrating how the gm,A and ION,A are calculated, where gm,A = gm/(WL), ION,A = ION/(WL) for cOECT, whereas gm,A = gm/(Wd), ION,A = ION/(Wd) for vOECT.

