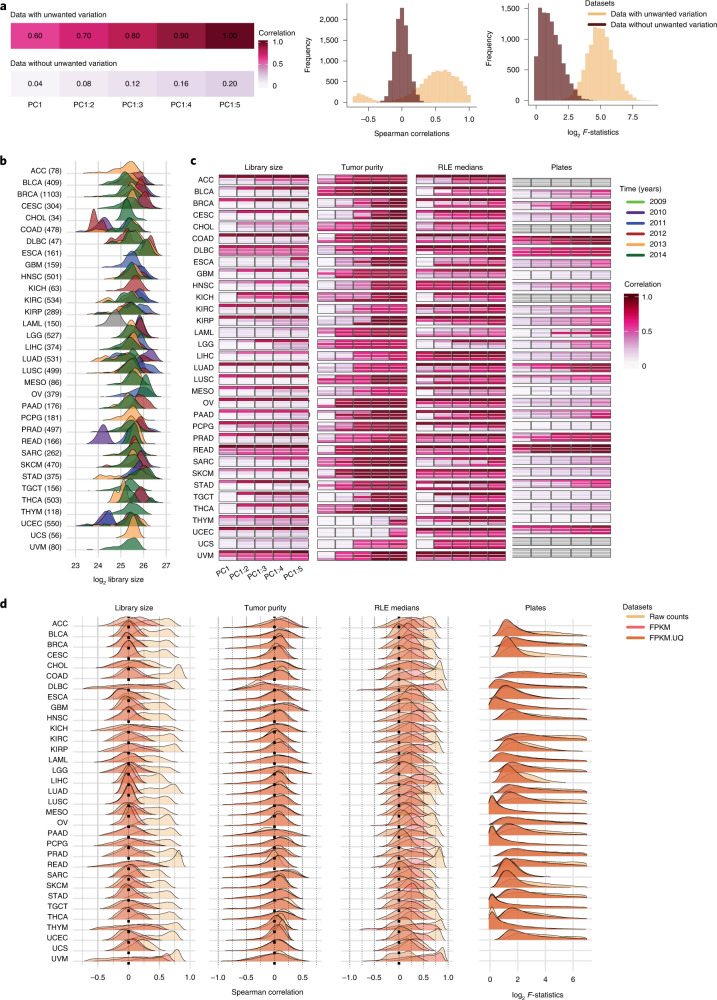
Fig. 1. Unwanted variation in individual TCGA RNA-seq datasets.
a, Illustrative examples showing data with and without unwanted variation. Data with unwanted variation exhibit high correlation between the first five PCs and this variation (top left). Data without unwanted variation have low correlation with unwanted variation (bottom left). The histograms show Spearman correlations and log2 F-statistics between individual genes and different sources of unwanted variation. Data with large library size and tumor purity variation show high Spearman correlations between individual gene expression and this variation. Data with plate effects exhibit high F-statistics obtained from ANOVA between individual gene expression and plates as factor. In contrast, data without such unwanted variation show low Spearman correlations and F-statistics. b, Distribution of (log2) library size colored by years for the individual TCGA cancer types. The year information was not available for the LAML RNA-seq study. The library sizes are calculated after removing lowly expressed genes for each cancer type. c, R2 obtained from linear regression between the first, first and second, and so on, cumulatively to the fifth PC and library size (first panel), tumor purity (second panel) and RLE medians (third panel) in the raw count, FPKM and FPKM.UQ normalized datasets. The fourth panel shows the vector correlation between the first five PCs cumulatively and plates in the datasets. Ideally, we should see no significant associations between PCs and sources of unwanted variation. Gray color indicates that samples were profiled across a single plate. d, Spearman correlation coefficients between individual gene expression levels and library size (first panel), tumor purity (second panel) and the RLE medians (third panel) in the datasets. The fourth panel shows log2 F-statistics obtained from ANOVA of gene expression levels by the factor: plate variable. Plates with fewer than three samples were excluded from the analyses. ANOVA was not possible for cancer types whose samples were profiled using a single plate.

