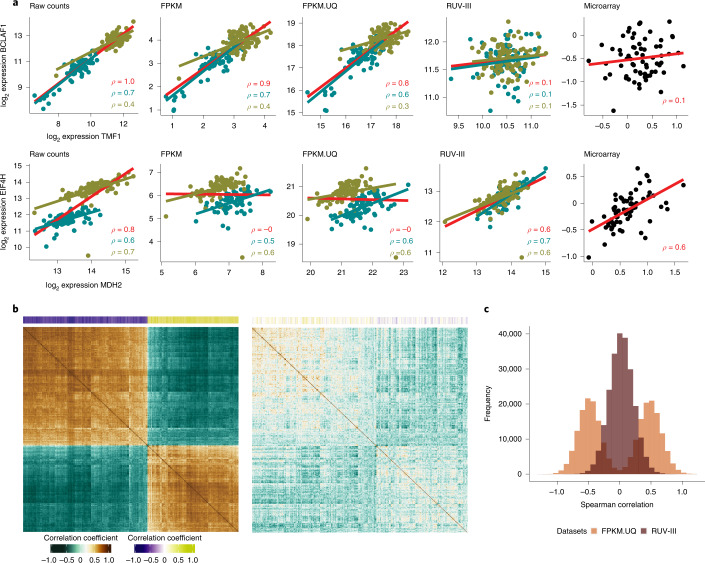
Fig. 3. Gene co-expression analyses of TCGA READ RNA-seq data using different normalizations.
a, First row: scatter plots of the gene expression levels of the TMF1 and BCLAF1 genes in the TCGA READ raw counts and differently normalized datasets. The red line shows overall association, and the cyan and olive lines show associations between the gene expression within 2010 samples and within the rest of the samples, respectively. Second row: same as the first row, for MDH2 and EIF4H gene expression. b, The correlation matrix of expression levels of the genes with the 500 highest correlations with library size in the FPKM.UQ. The first plot is obtained using FPKM.UQ, and the second plot is obtained using the RUV-III normalized data. The colored bar along the top shows the correlation of individual genes with library size. The order of rows and columns is the same in both correlation matrices. c, Differences (ρmicroarray – ρRNA-seq) of Spearman correlation coefficients for all possible gene–gene pairs calculated using the TCGA READ microarray and both the FPKM.UQ and RUV-III normalized RNA-seq data.

