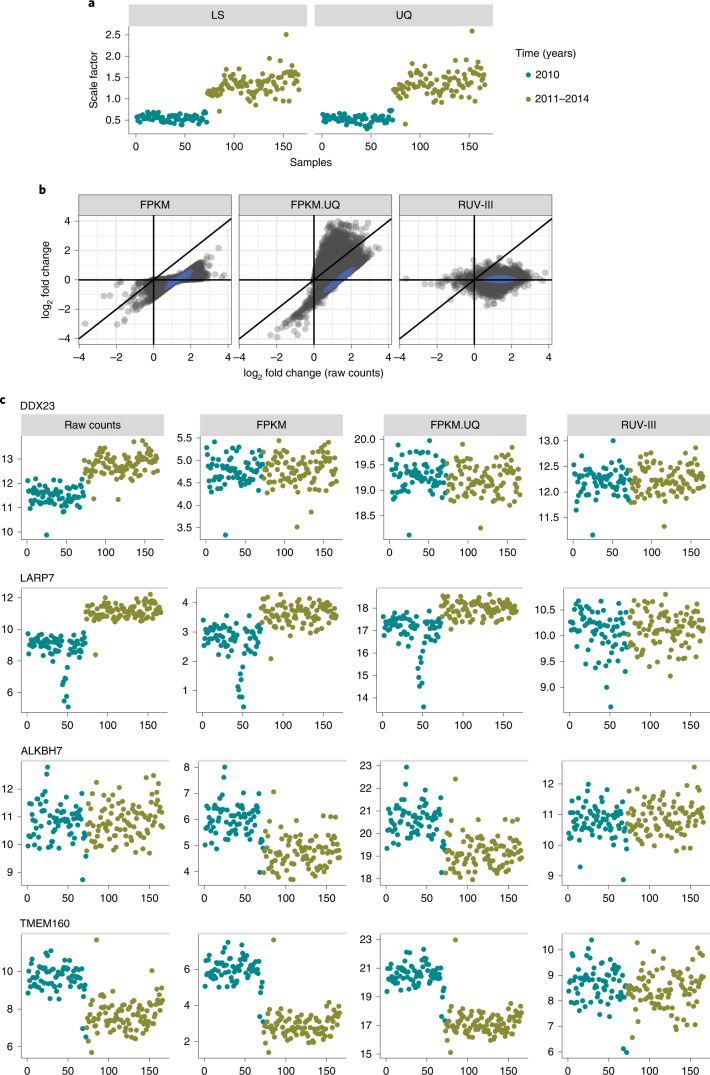
Fig. 5. Relationship between gene-level (log2) counts and (log2) library size in the TCGA READ RNA-seq data.
a, Global scale factors obtained by sample library sizes (LS) (left) and upper quartiles (UQ) (right) of READ raw counts versus time. b, Scatter plots of log2 fold change obtained from DE analyses of gene expression levels with the major time variation: 2010 versus 2011–2014; (log2) raw READ counts on the horizontal axes of all plots and differently normalized counts vertically. c, Expression patterns of four genes (DDX23, LARP7, ALKBH7 and TMEM160) whose counts have different relationships with the global scaling factors calculated from the TCGA READ raw count data.

