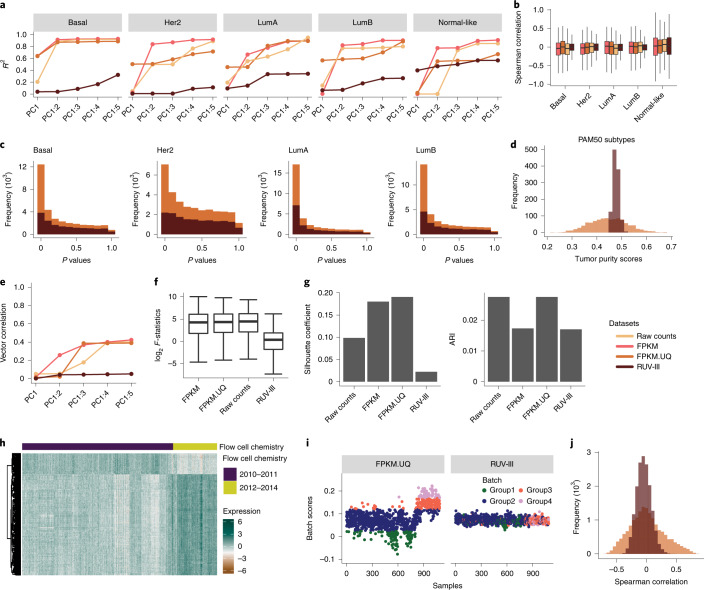
Fig. 6. RUV-III removes tumor purity and flow cell chemistry variation from the TCGA BRCA RNA-seq data.
a, R2 obtained from linear regression between the first five PCs (cumulatively) and tumor purity within individual PAM50 subtypes in the differently normalized datasets. The numbers of samples for each subtype and normalization are shown in Supplementary Fig. 27a. b, Box plots of Spearman correlation coefficients between individual gene expression and tumor purity levels in the differently normalized datasets (n = 16,537 genes). c, Unadjusted P value histograms of DE analysis between samples with low and high tumor purity within the four main PAM50 subtypes in the FPKM.UQ and the RUV-III normalized datasets. P values were obtained using Wilcoxon signed-rank test. d, Distributions of tumor purity scores in the FPKM.UQ and RUV-III normalized datasets. e, Vector correlation between the first five PCs (cumulatively) and flow cell chemistry in the normalized datasets. f, Box plots of log2 F-statistics obtained from ANOVA between individual gene expression levels and the flow cell chemistry factor in the differently normalized datasets (n = 16,537 genes). g, Bar charts of silhouette coefficients and ARIs showing the performance of different normalization methods in mixing samples from the two flow cell chemistries. h, Gene expression heat map of the 400 genes that are highly affected by the flow cell chemistries in the TCGA FPKM.UQ data (rows are clustered; columns are in chronological order of sample processing). i, Batch scores across samples in the FPKM.UQ (left) and RUV-III (right) normalized datasets. The batch scores were calculated by the singscore method using the 400 genes described in h. Samples were divided into four groups based on their batch scores. j, Spearman correlation coefficients between the batch scores and individual gene expression levels in the FPKM and RUV-III normalized datasets. In the box plots (b and f), the heavy middle line represents the median; the box shows the IQR; the upper and lower whiskers extend from the hinges no further than 1.5× IQR; and any outliers beyond the whiskers are shown as points.

