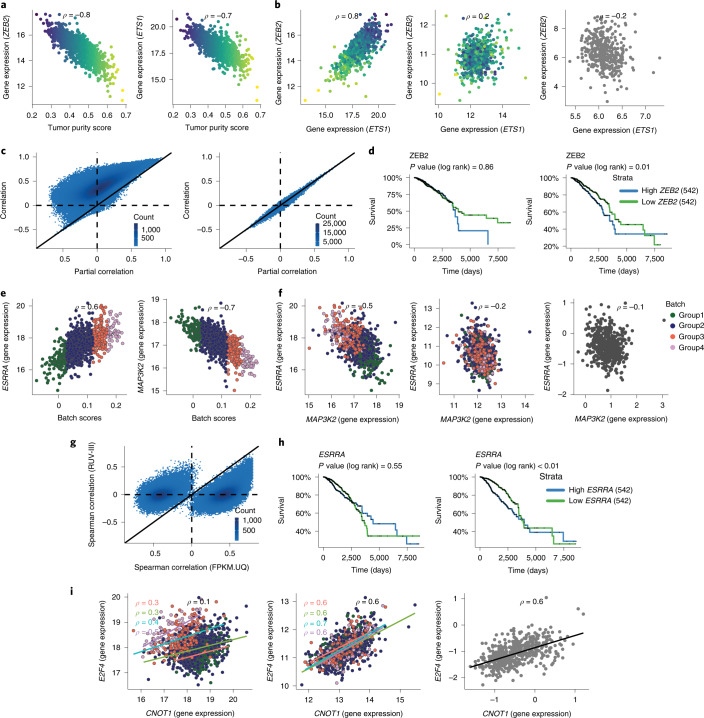
Fig. 7. Impact of tumor purity and flow cell chemistry variation on gene co-expression and survival analysis in the TCGA BRCA RNA-seq data.
a, Relationship between tumor purity scores and the ZEB2 and ETS1 gene expression in the FPKM data. b, Scatter plots exhibit relationship between the ZEB2 and ETS1 gene expression in the FPKM data (left), the RUV-III normalized data (middle) and the LCM microarray data (right). c, Scatter plots show the Spearman correlation coefficients and partial correlation coefficients for all possible pairs of the genes that have the 1,300 highest correlations with tumor purity in the TCGA FPKM.UQ (left) and RUV-III normalized data (right). d, Kaplan–Meier survival analysis shows the association between the ZEB2 gene expression and overall survival in the FPKM.UQ (left) and the RUV-III normalized data (right). e, Relationship between the ESSRA and MAP3K2 gene expression with the batch scores in the FPKM.UQ data. f, Scatter plots show the relationship between the ESSRA and MAP3K2 gene expression in the FPKM.UQ (left), the RUV-III normalized data (middle) and the TCGA BRCA microarray data (right). g, Scatter plots display Spearman correlation coefficients of all possible pairs of genes that are highly affected by flow cell chemistries in the FPKM.UQ and the RUV-III normalized data. h, Kaplan–Meier survival analysis shows the association between the ESSRA gene expression and overall survival in the FPKM.UQ (left) and the RUV-III normalized data (right). i, Scatter plots exhibit the relationship between the E2F4 and CNOT1 gene expression in the FPKM.UQ (left), the RUV-III normalized data (middle) and the TCGA BRCA microarray data (right).

