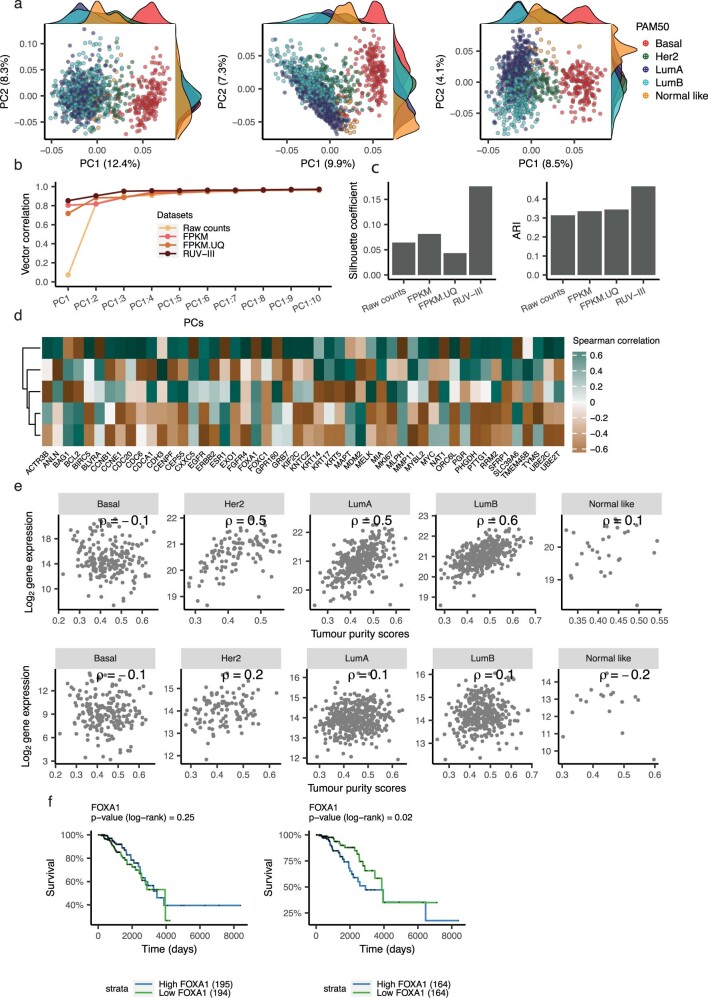
Extended Data Fig. 1. RUV-III improves the PAM50 clusters in the TCGA BRCA RNA-seq data.
a) Scatter plot of the first two principal components colored by the PAM50 subtypes in the FPKM (left), FPKM.UQ (middle), and the RUV-III (right) normalized datasets. b) Vector correlation analysis between the first ten principal components cumulatively and the PAM50 subtypes in the differently normalized datasets. c) Silhouette coefficients and ARI showing how the PAM50 clusters are separated in the differently normalized datasets. d) The heatmap gives the Spearman correlation coefficients between the expression levels of the PAM50 signature genes and the tumor purity scores in the FPKM.UQ data. e) Scatter plots show relationship between the gene expression levels of FOXA1 and tumor purity within the individual PAM50 subtypes in the FPKM.UQ (first row) and the RUV-III normalized data (second row). f) Kaplan Meier survival analyses for samples with low and high expression of FOXA1 gene in Luminal-B subtype in the FPKM.UQ (left) and the RUV-III normalized data (right).

