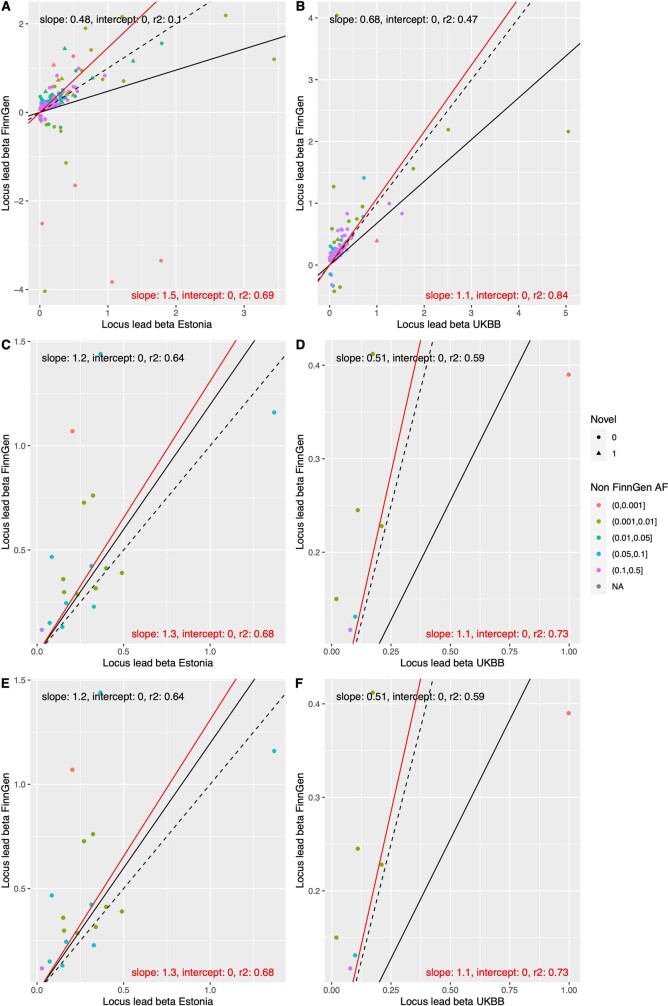
Extended Data Fig. 3. Comparison of effect sizes between biobanks.
A,B) Effect size (log(OR), beta) comparison of 275 genome-wide significant lead variants identified in FinnGen among 15 analysed diseases in Estonia and UKBB. The sign of beta is aligned to be positive in Estonia and UKBB. C,D) beta comparison of variants only in known loci. E,F) beta comparison of novel loci. Dashed lines indicates identity line and solid lines are the regression line (red line and text weighted by pooled standard error of betas).

