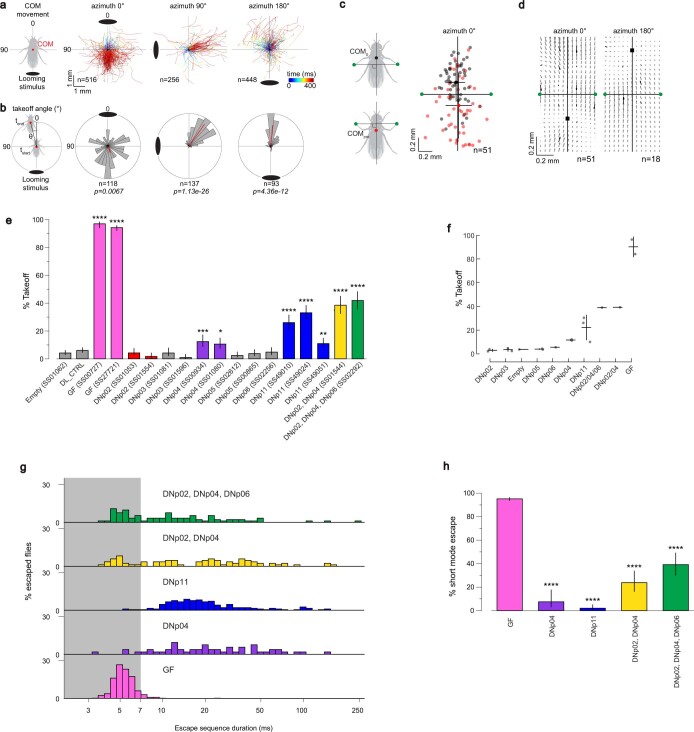
Extended Data Fig. 1. Control of fly takeoff direction.
a, When shown a looming stimulus from the front (azimuth 0°), side (azimuth 90°), or back (azimuth 180°), flies respond by moving their center of mass (COM) away from the stimulus. Black disc represents stimulus location and color indicates time from stimulus onset. Flies used for a–d were a control genotype for other experiments, Empty>Kir2.1. One trial per fly. b, Some flies also takeoff in response to looming, and those that do takeoff in a direction away from the stimulus (with some influence of the heading of the fly33). Shown are polar takeoff direction histograms with 12° bin width and mean resultant vector overlaid (red line). p, Hodges-Ajne test for angular uniformity. c, Takeoff direction results from the fly shifting its COM relative to the axes formed by a line connecting the ground contact points of its two middle jumping legs and a perpendicular bisector. Black points indicate COM at stimulus onset and red points indicate COM just prior to takeoff. d, The specific direction in which the COM moves in body coordinates depends on its starting location. Vector position is the COM position at stimulus onset. The vector itself indicates the shift of COM position from stimulus onset to just prior to takeoff. Black vectors are tracked data, gray vectors are interpolated. Black square is approximated point of convergence. e, Percent of flies (individual DN driver lines) that performed a takeoff in response to CsChrimson optogenetic activation in the FlyPEZ assay. Error bars, Wilson score interval; *p < 0.05, **p < 0.01, ***p < 0.001, ****p < 0.0001 vs control (Empty, empty brain split-Gal4 control; DL – wild type control); normal approximation to binomial, two-sided Z-test, Bonferroni correction post hoc test. f, Same data as in (e) but with driver lines grouped by cell type. Error bars, SD. g, Histograms displaying the distribution of escape sequence durations between the wing raising and takeoff jump sub-behaviors (for LC4-DN driver lines expressing CsChrimson that can elicit escape upon activation). Escape trials are combined from split-Gal4 lines for each LC4-DN type. Short-mode escape duration (0 to 7 ms, gray shaded region) and long-mode escape duration (>7 ms), as previously established. h, Percentage of short-mode activated escapes. Error bars, Wilson score interval; ****p < 0.0001 versus GF; normal approximation to binomial, two-sided Z-test, Bonferroni correction post hoc test. Detailed description of statistical tests used and p-values for panels “e” and “h” is available in Supplementary Table 1.

