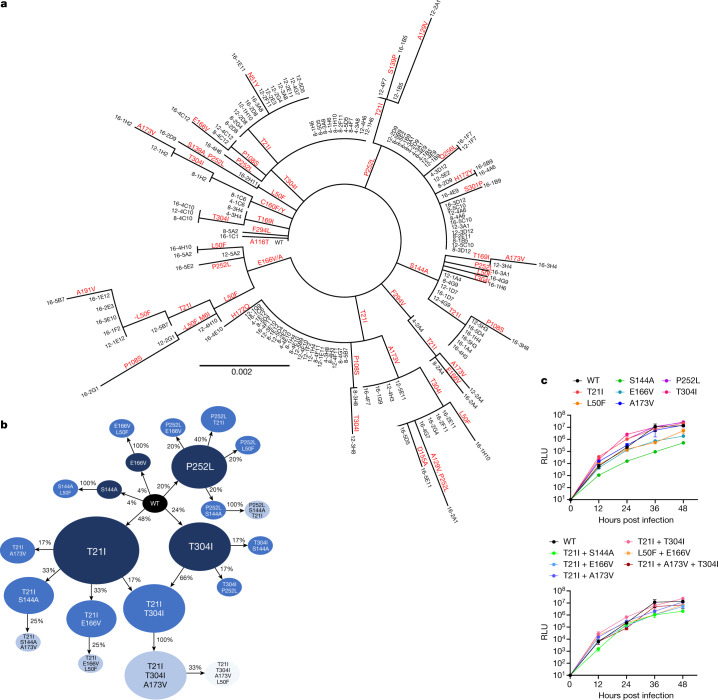
Fig. 3. Pathways for SARS-CoV-2 resistance to nirmatrelvir.
a, Phylogenetic tree of sequences from passaging in Huh7-ACE2 cells. Only sequences with mutations are shown. Sequences are denoted as passage number, followed by the well number. Mutations that arose along particular branches are annotated in red; ‘-’ denotes when a mutation appears to have been lost from a particular branch. b, Observed pathways for nirmatrelvir resistance in Huh7-ACE2 cells. The most commonly observed mutations in passage 16 were used to build these pathways (Methods and Supplementary Table 2). Nodes are shaded from dark to light, with founder mutations darker. Percentages indicate the frequency by which child nodes derive from the immediate parental node. Descendent arrows that do not sum to 100% indicate that a proportion did not advance beyond the indicated mutations in the experiment. c, Growth assay with recombinant live SARS-CoV-2 carrying single (top) and combination 3CLpro mutations (bottom). Huh7-ACE2 cells were infected with 0.01 multiplicity of infection (MOI) of virus, and luminescence was quantified at the indicated time points. S144A, E166V and T21I + S144A are statistically significant from WT at 48 h (two-way analysis of variance with Geisser–Greenhouse correction followed by Dunnett’s multiple comparisons test; P = 0.0039, P = 0.0006, P = 0.0006, respectively). Representative curves from a single experiment from two biologically independent experiments are shown. Error bars denote mean ± s.e.m of three technical replicates. RLU, relative luminescence units.

