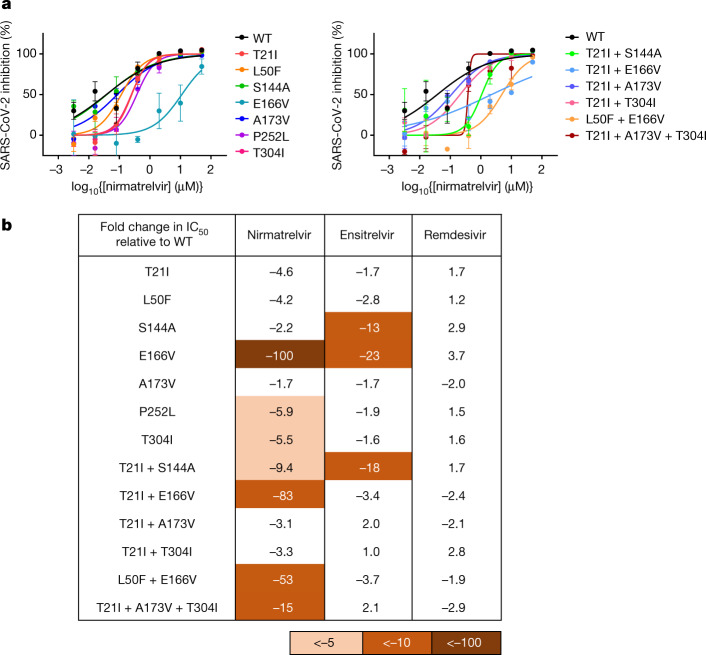
Fig. 4. Validation of identified mutations in isogenic recombinant SARS-CoV-2.
a, Individual inhibition curves of recombinant live SARS-CoV-2 carrying single (left) and combination 3CLpro mutations (right) by nirmatrelvir. Representative curves from a single experiment from three biologically independent experiments are shown. Error bars denote mean ± s.e.m of three technical replicates. b, Inhibition of recombinant live SARS-CoV-2 carrying single and combination 3CLpro mutations by nirmatrelvir, ensitrelvir and remdesivir. Values shown are fold change of mean values in IC50 relative to inhibition of WT from three biologically independent experiments.

