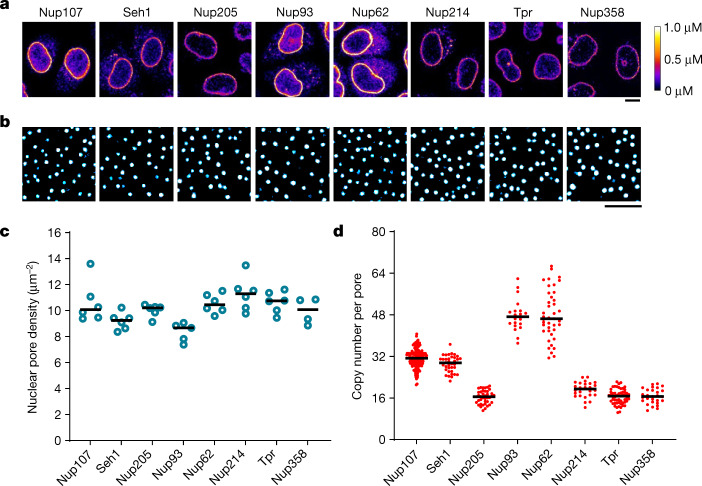
Fig. 1. Quantitative imaging of GFP-knock-in Nup cell lines.
a, Confocal microscopy of genome-edited HeLa cells with homozygous expression of mEGFP-tagged Nups. Fluorescence intensity was converted to protein concentration (colour bar) using FCS-calibrated imaging22. Images were filtered with a median filter (kernel size: 0.25 × 0.25 μm) for presentation purposes. Scale bar, 10 μm. b,c, Stimulated emission depletion (STED) microscopy of genome-edited cells stained with Nup62 antibody. Cells were imaged (b) and the density of nuclear pores was quantified (c). n = 6 (Nup107), 6 (Seh1), 6 (Nup205), 5 (Nup93), 6 (Nup62), 6 (Nup214), 6 (Tpr) and 4 (Nup358) cells. Scale bar, 1 μm. d, Calculated copy number of Nups per nuclear pore. n = 241 (Nup107), 37 (Seh1), 41 (Nup205), 20 (Nup93), 41 (Nup62), 26 (Nup214), 55 (Tpr) and 28 (Nup358) cells. The horizontal line represents the median.

