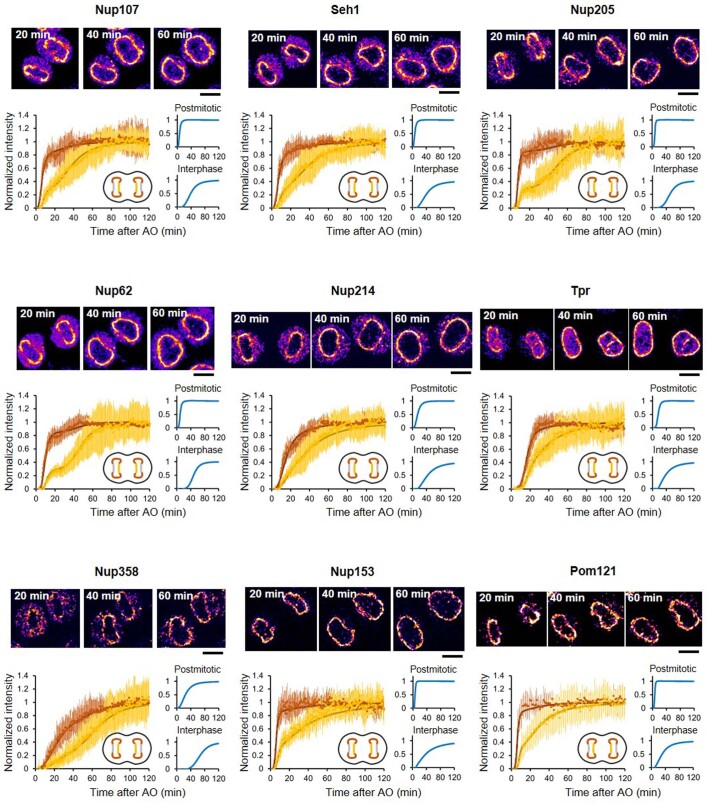
Extended Data Fig. 6. Kinetic decomposition of the two assembly processes for each nucleoporin.
The fluorescence intensities at non-core (brown) and inner-core (yellow) regions were plotted and fitted with a sequential model of NPC assembly (bold lines) as in Extended Data Fig. 5. Dots represent the average and s.d. of measurements from 15, 20, 13, 14, 22, 22, 19, 24, 14 and 13 cells for Nup107, Seh1, Nup205, Nup93, Nup62, Nup214, Tpr, Nup358, Nup153, and Pom121, respectively. Single confocal slices of cells at 20 min, 40 min, and 60 min after AO are shown. Images were filtered with a median filter (kernel size: 0.25 × 0.25 μm) for presentation purposes. Scale bars, 10 μm.

