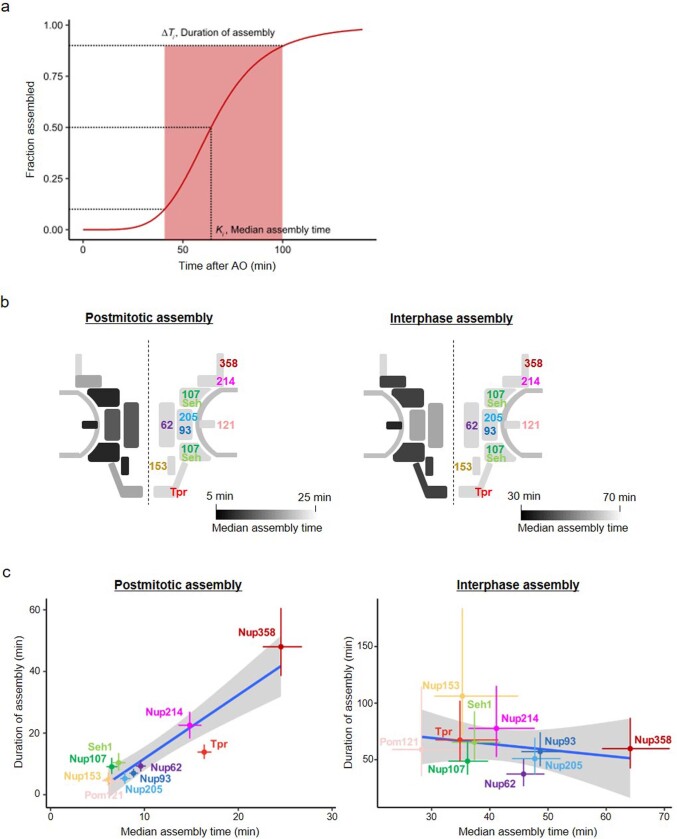
Extended Data Fig. 7. Computed parameters for the nucleoporin assembly kinetics and the remarkable difference between postmitotic and interphase assembly.
a, An example of computed quantities (Nup358, interphase assembly). b, Illustrations of median assembly time of nucleoporins in postmitotic (left) and interphase (right) assembly superimposed onto a simplified scheme of the NPC. The median assembly time of individual nucleoporins are displayed on a pseudo-colour scale. c, Plots of Nup assembly duration along the median assembly time for postmitotic and interphase assembly pathways. The crosses indicate the 95% confidence intervals. The dots are the mean values. Values are listed in Supplementary Table 3. The long straight line shows the result of a linear regression to the mean values. The gray area is the 95% confidence interval of the linear regression. Theoretically, for a sequential assembly mechanism where late steps depend on early steps, the observed ensemble kinetics of a late binding protein must contain the history of all previous events (see Methods for details). Indeed, postmitotic assembly showed a strong positive linear correlation, indicating a sequential assembly mechanism, which for example implies that Nup62 is incorporated into the NPC before Tpr can bind.

