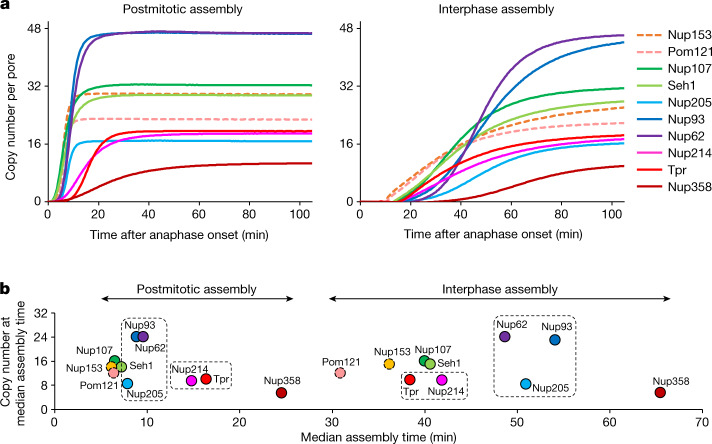
Fig. 3. The molecular assembly order and maturation kinetics are distinct for postmitotic and interphase assembly.
a, The average copy number per nuclear pore computed from mathematical modelling for postmitotic (left) and interphase (right) assembly (details in Methods and Extended Data Figs. 5 and 6). For Nup153 and Pom121 (dashed lines), the absolute amount was estimated using the copy number determined from a previous study23 (32 for Nup153 and 16 for Pom121). b, The average copy number of individual Nups per nuclear pore are plotted along their median assembly time in postmitotic and interphase assembly pathways. Boxes highlight the Nups that show marked differences in their order of assembly between the two pathways.

