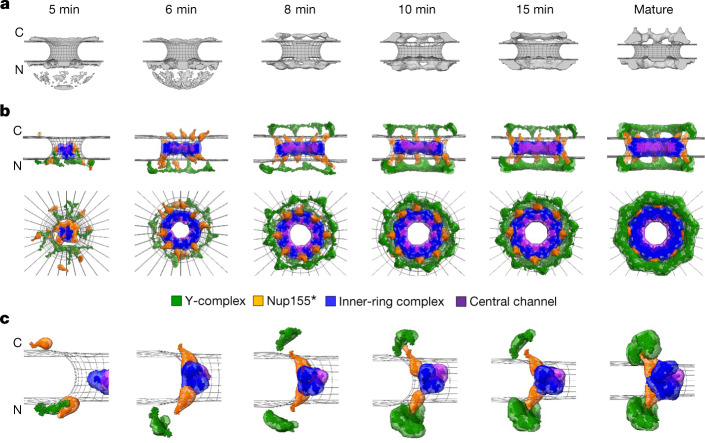
Fig. 5. Integrative model of the postmitotic NPC assembly pathway.
a, Protein density (grey) overlaid with the nuclear envelope surface (wireframe model, grey) at each time point12 used for integrative modelling. C, cytoplasm; N, nucleoplasm. The dome-like density in the nucleoplasmic side at 5 and 6 min is the noise from electron tomography. b, The best-scoring model of the postmitotic assembly pathway (top and side views). The uncertainty of each Nup localization is indicated by the density of the corresponding colour. The Y-complex is shown in green; an isolated fraction of Nup155 that is not forming a complex with Nup93, Nup188 and Nup205 is shown in orange; Nup93–Nup188–Nup155 and Nup205–Nup93–Nup155 complexes are in blue; and the Nup62–Nup58–Nup54 complex is in purple. c, The enlargement of one of the spokes. The model has a much higher score than all the other lower-scoring pathways (Extended Data Fig. 8). The pseudoatomic model of the native NPC structure27,28 we imposed as the endpoint of the assembly pathway does not include the Y-complex-bound fraction of Nup205 or the Nup214-bound fraction of Nup62, and thus contains only 16 of the 40 copies of Nup20533,34 and 32 of the 48 copies of Nup6235 in the fully mature NPC. How the remaining 24 copies of Nup205 and 16 copies of Nup62 are assembled remains elusive.

