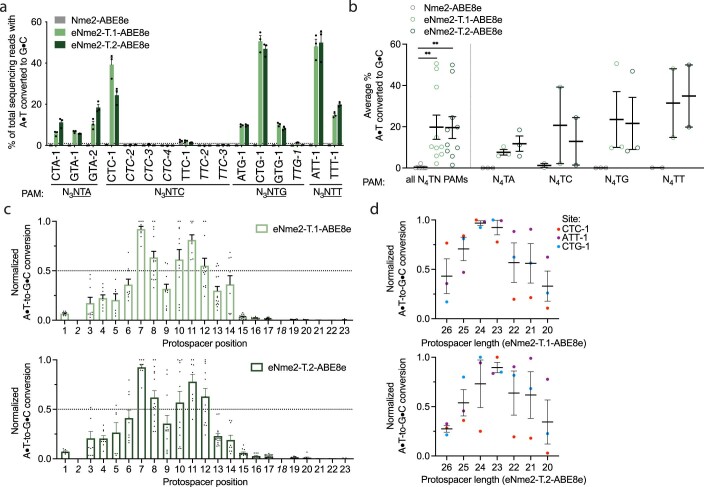
Extended Data Fig. 6. N4TN activity, editing window, and preferred spacer length of eNme2- T.1-ABE8e and eNme2- T.2-ABE8e.
(a) Adenine base editing activity of eNme2-T.1-ABE8e and eNme2-T.2-ABE8e at 16 N3NTN PAM-containing sites in HEK293T cells. Mean±SEM is shown and reflects the average activity and standard error of n = 3 independent biological replicates at the maximally edited position within each genomic site. The six sites that exhibited <1% base editing activity for either variant (line shown) that were excluded in subsequent analyses are italicized. (b) Pooled adenine base editing activity of eNme2-T.1-ABE8e and eNme2-T.2-ABE8e from (a). Left: all 10 sites; right: sites pooled by PAM position 6 identity. Each point represents the average of n = 3 independent biological replicates measured at the maximally edited position within each given genomic site. Mean±SEM is shown and reflects the average activity and standard error of the pooled genomic site averages. (c) Editing window of eNme2-T.1-ABE8e (top) or eNme2-T.2-ABE8e (bottom) reflective of pooled adenine base editing activity at all 23 protospacer positions (PAM counted as positions 24–29) of the 10 sites shown in (a). Each point represents the % A•T-to-G•C conversion observed for an adenine that was present in one of the 10 protospacers, normalized to the highest editing observed within that protospacer. The italicized positions (2 and 18) were not present in any protospacers evaluated. Mean±SEM is shown and reflects the average normalized activity and standard error at all observed adenines at that position. (d) Adenine base editing activity of eNme2-T.1- ABE8e (top) or eNme2-T.2-ABE8e (bottom) as a function of protospacer length at three different genomic sites in HEK293T cells. Each point represents the average of n = 3 independent biological replicates observed for a given protospacer length at one genomic site, normalized to the protospacer length with the highest base editing activity for that site. Mean±SEM is shown and reflects the average normalized activity and standard error of the pooled averages at the observed sites. **, p } 0.01 by individual unpaired, two- tailed Student’s t-tests comparing Nme2-ABE8e to either eNme2-T.1-ABE8e (p = 0.0039) or eNme2-T.2-ABE8e (p = 0.0018).

