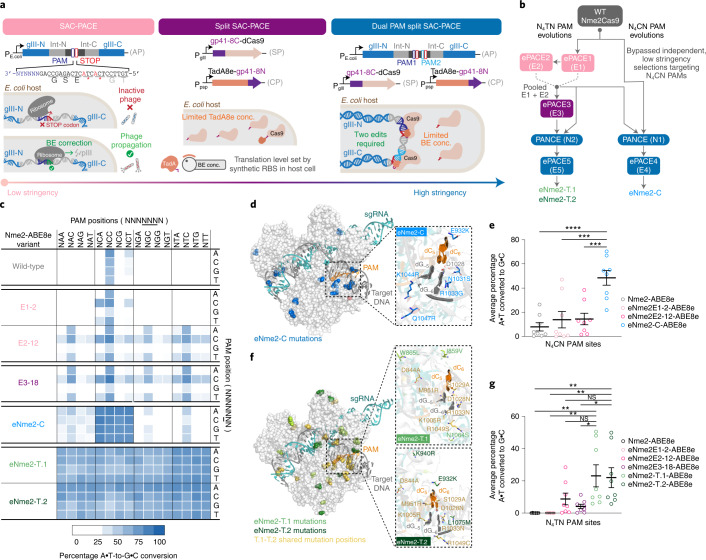
Fig. 2. Evolution of Nme2Cas9 variants with broadened PAM activity.
a, SAC-PACE modifications increasing selection stringency. Left, original selection scheme; middle, split SAC-PACE selection and right, dual-PAM split SAC-PACE. b, Evolution campaigns toward Nme2Cas9 variants with N4CN or N4TN PAM compatibility. c, Summary heat map showing ABE-PPA activity for representative variants across both evolutionary trajectories. Values plotted are raw observed percentage A•T-to-G•C conversion for one replicate of each base editor. d, Mutation overview of the eNme2-C variant, mapped onto the crystal structure of wild-type Nme2Cas9 (Protein Data Bank (PDB) 6JE3), mutated positions are shown in blue. The inset shows the wild-type PAM and PAM-interacting residues (D1028, R1033), with evolved mutations listed. e, Summary dot plots showing the progression of mammalian cell adenine base editing activity at eight N4CN PAM-containing sites for representative variants from the N4CN evolution trajectory. f, Mutation overview of the eNme2-T.1 and eNme2-T.2 variants, mapped onto the crystal structure of wild-type Nme2Cas9 (PDB 6JE3). Positions mutated in both variants are shown in yellow. Mutations unique to eNme2-T.1 are shown in light green. Mutations unique to eNme2-T.2 are shown in dark green. The insets show the wild-type PAM and PAM-interacting residues (D1028, R1033), along with new mutations listed. g, Summary dot plots showing the progression of mammalian cell adenine base editing activity at eight N4TN PAM-containing sites for representative variants from the N4TN evolution trajectory. For e and g, each point represents the average editing of n = 3 independent biological replicates measured at the maximally edited position within each genomic site. Mean ± s.e.m. is shown and reflects the average activity and standard error of the pooled genomic site averages. NS, P > 0.05; *P ≤ 0.05; **P ≤ 0.01, ***P ≤ 0.001, ****P ≤ 0.0001. P values determined by Sidak’s multiple comparisons test following ordinary one-way analysis of variance. For e, eNme2-C-ABE8e versus Nme2-ABE8e (P < 0.0001), eNme2E1-2-ABE8e (P = 0.0003), eNme2E2-12-ABE8e (P = 0.0004) and for g eNme2-T.1-ABE8e versus Nme2-ABE8e (P = 0.0020), eNme2E1-2-ABE8e (P = 0.0020), eNme2E2-12-ABE8e (P = 0.1252), eNme2E3-18-ABE8e (P = 0.0157) or eNme2-T.2-ABE8e versus Nme2-ABE8e (P = 0.0037), eNme2E1-2-ABE8e (P = 0.0037), eNme2E2-12-ABE8e (P = 0.1947) and eNme2E3-18-ABE8e (P = 0.0272).

